Enovix SPAC Presentation Deck
37
Financials
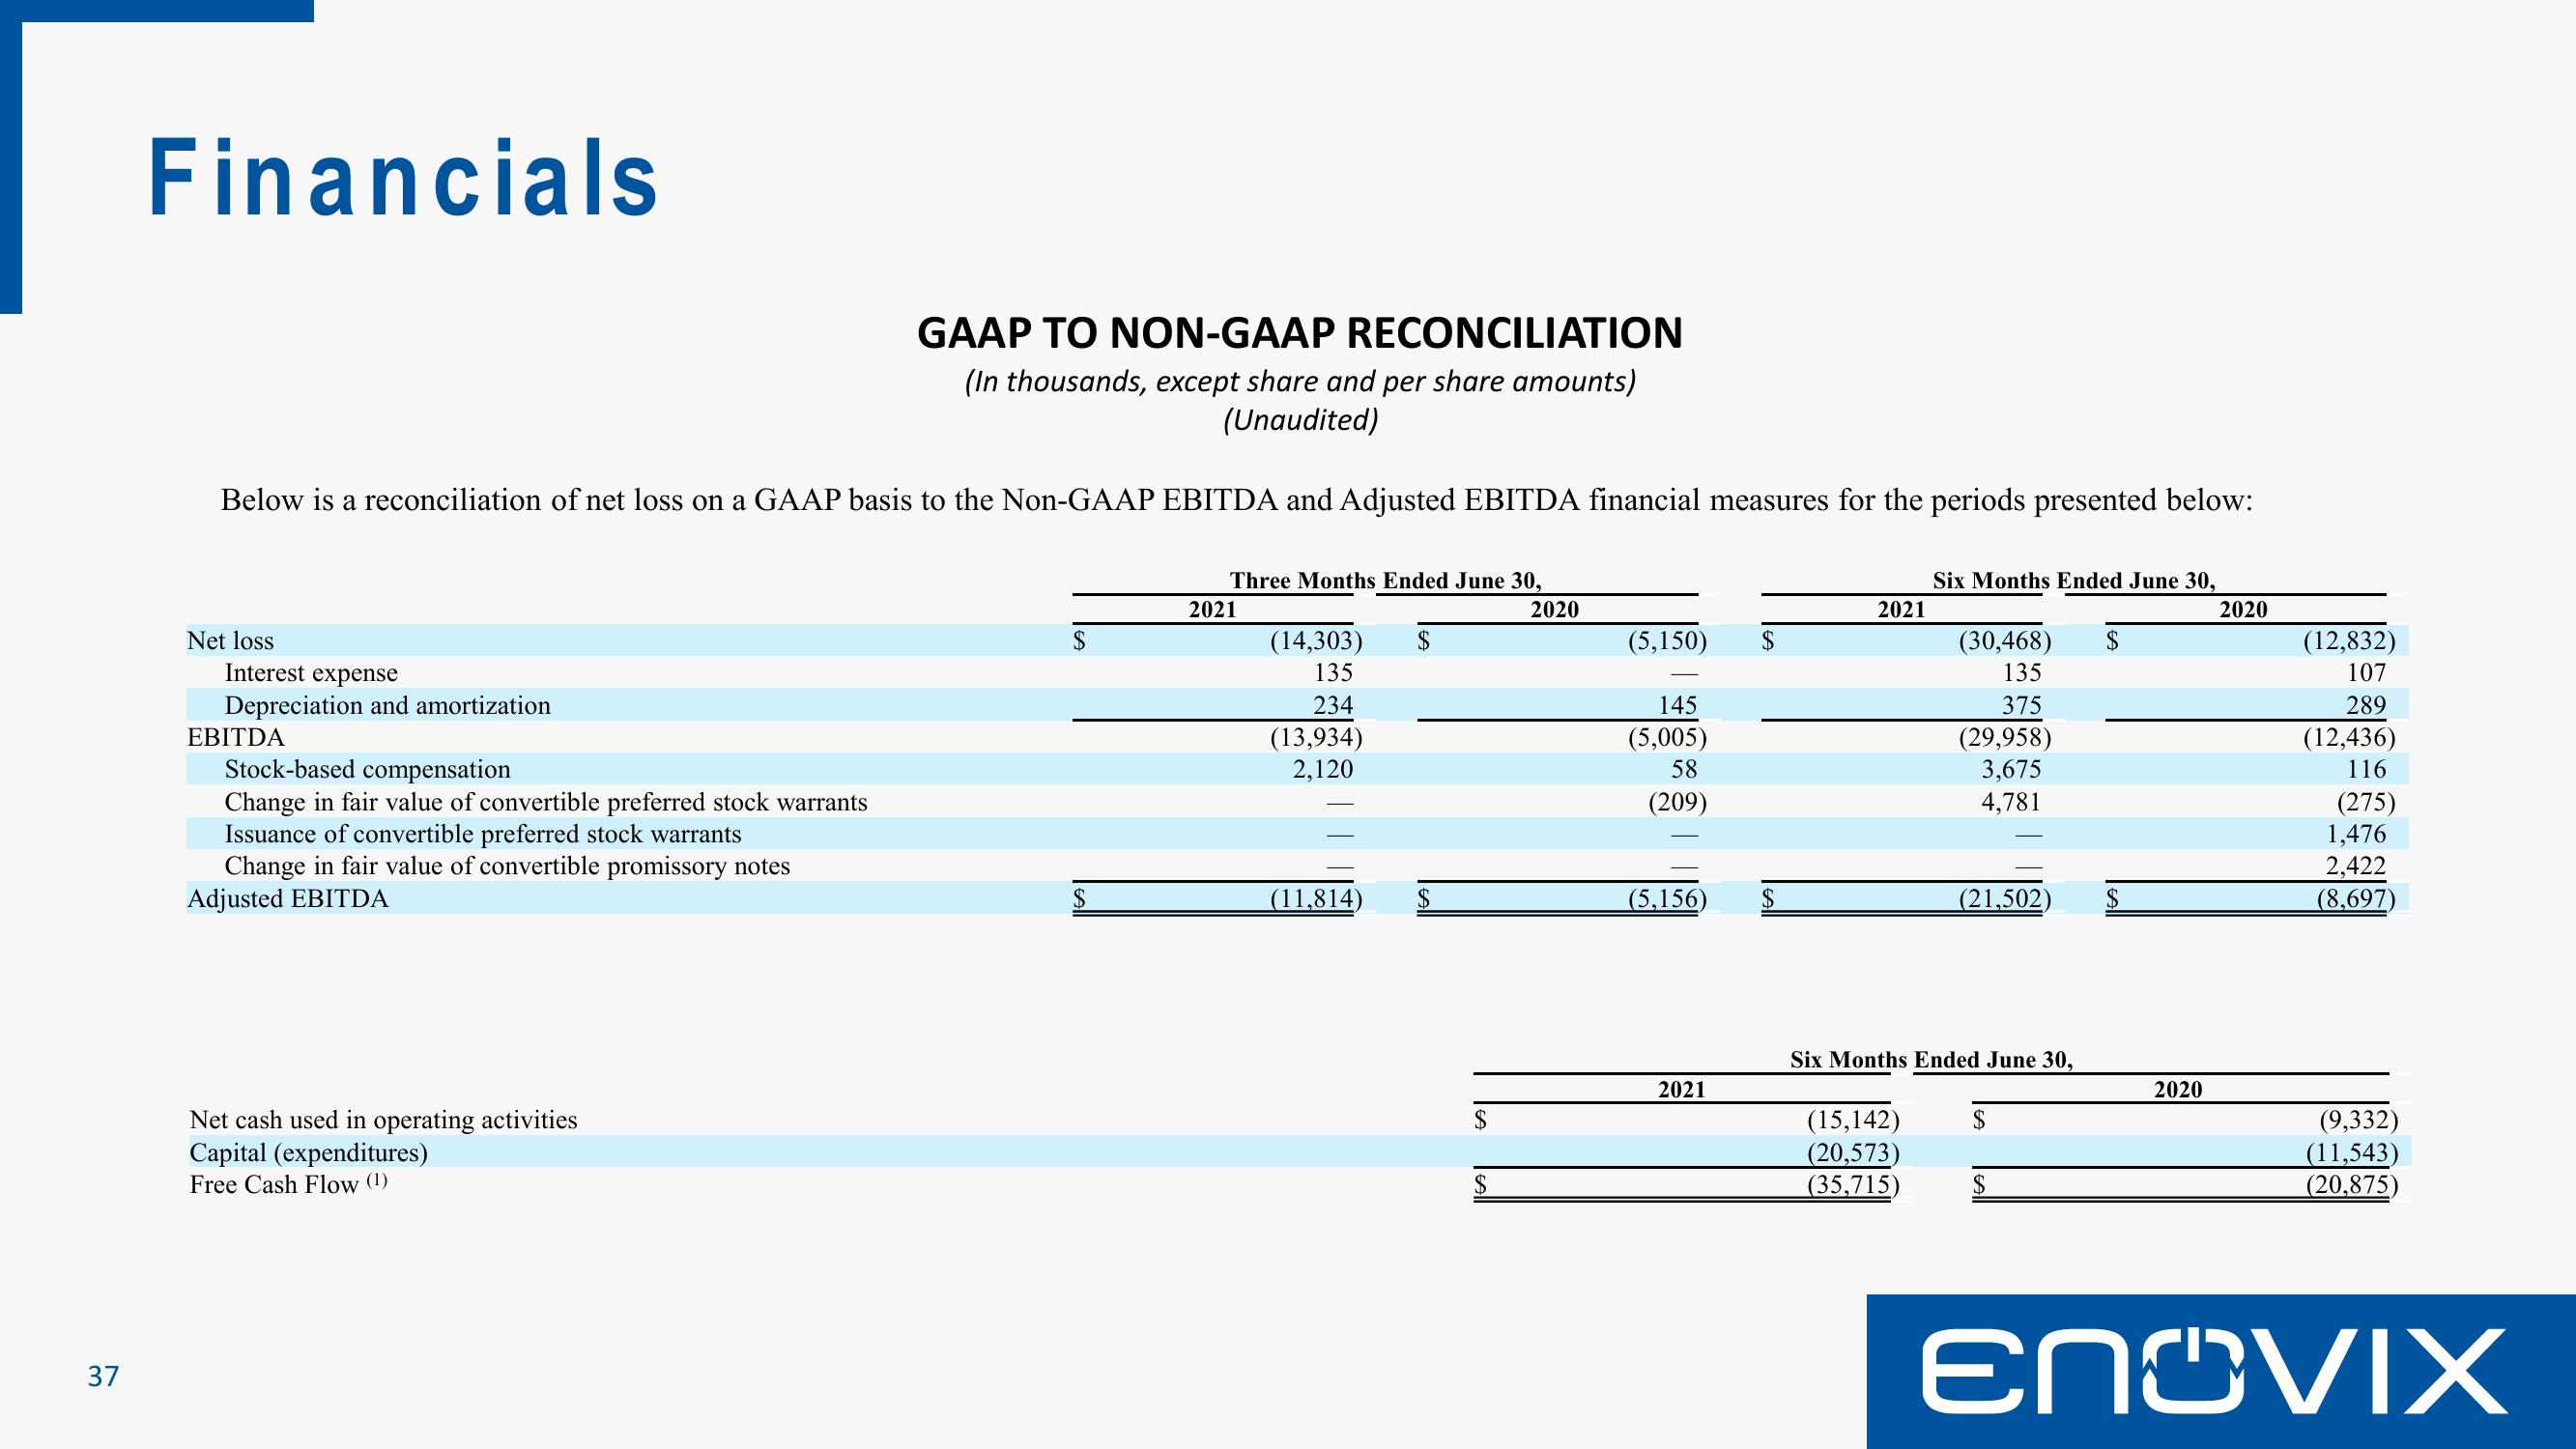
GAAP TO NON-GAAP RECONCILIATION
(In thousands, except share and per share amounts)
(Unaudited)
Below is a reconciliation of net loss on a GAAP basis to the Non-GAAP EBITDA and Adjusted EBITDA financial measures for the periods presented below:
Three Months Ended June 30,
2020
Net loss
Interest expense
Depreciation and amortization
EBITDA
Stock-based compensation
Change in fair value of convertible preferred stock warrants
Issuance of convertible preferred stock warrants
Change in fair value of convertible promissory notes
Adjusted EBITDA
Net cash used in operating activities
Capital (expenditures)
Free Cash Flow (1)
$
2021
(14,303) $
135
234
(13,934)
2,120
(11,814)
$
$
(5,150) $
145
(5,005)
58
(209)
(5,156)
2021
2021
Six Months Ended June 30,
(15,142)
(20,573)
(35,715)
(30,468)
135
375
(29,958)
3,675
4,781
Six Months Ended June 30,
$
(21,502) $
2020
2020
(12,832)
107
289
(12,436)
116
(275)
1,476
2,422
(8,697)
(9,332)
(11,543)
(20,875)
ENOVIXView entire presentation