First Foundation Investor Presentation Deck
Non-GAAP Efficiency Ratio
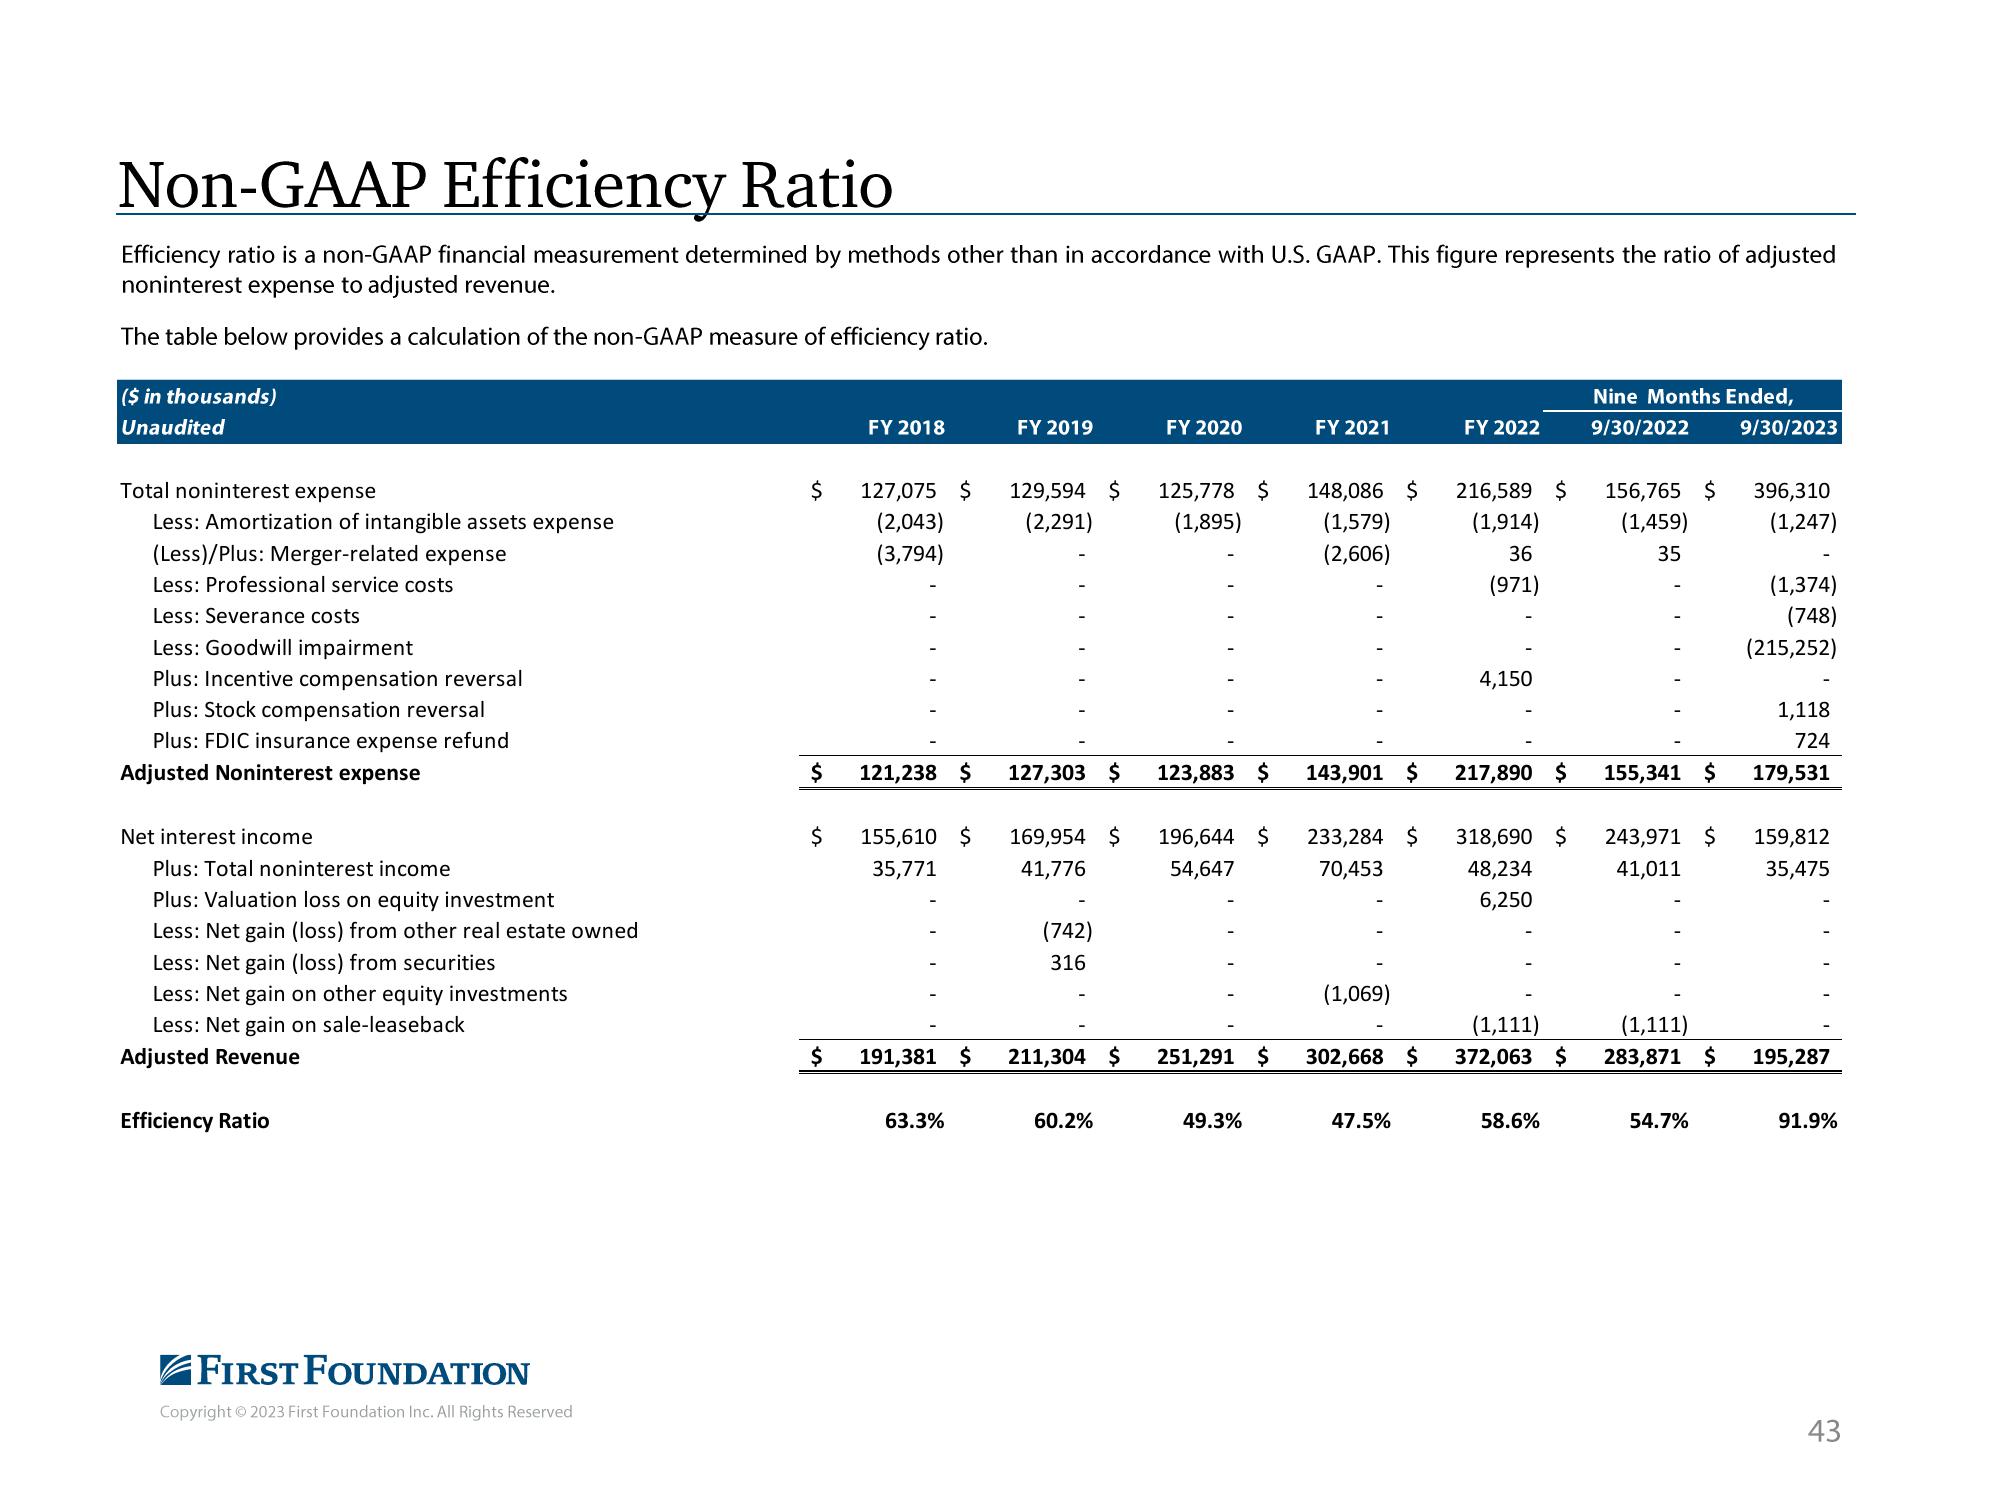
Efficiency ratio is a non-GAAP financial measurement determined by methods other than in accordance with U.S. GAAP. This figure represents the ratio of adjusted
noninterest expense to adjusted revenue.
The table below provides a calculation of the non-GAAP measure of efficiency ratio.
($ in thousands)
Unaudited
Total noninterest expense
Less: Amortization of intangible assets expense
(Less)/Plus: Merger-related expense
Less: Professional service costs
Less: Severance costs
Less: Goodwill impairment
Plus: Incentive compensation reversal
Plus: Stock compensation reversal
Plus: FDIC insurance expense refund
Adjusted Noninterest expense
Net interest income
Plus: Total noninterest income
Plus: Valuation loss on equity investment
Less: Net gain (loss) from other real estate owned
Less: Net gain (loss) from securities
Less: Net gain on other equity investments
Less: Net gain on sale-leaseback
Adjusted Revenue
Efficiency Ratio
FIRST FOUNDATION
Copyright © 2023 First Foundation Inc. All Rights Reserved
$
FY 2018
$
127,075 $
(2,043)
(3,794)
$ 121,238 $
155,610 $
35,771
FY 2019
63.3%
129,594 $
(2,291)
127,303 $
169,954 $
41,776
(742)
316
$ 191,381 $ 211,304 $
60.2%
FY 2020
125,778 $
(1,895)
123,883 $
196,644 $
54,647
251,291 $
49.3%
FY 2021
148,086 $
(1,579)
(2,606)
143,901 $
233,284 $
70,453
(1,069)
302,668
47.5%
FY 2022
216,589 $
(1,914)
36
(971)
4,150
217,890 $
318,690 $
48,234
6,250
Nine Months Ended,
9/30/2022 9/30/2023
58.6%
156,765 $
(1,459)
35
155,341 $
243,971 $
41,011
(1,111)
(1,111)
372,063 $ 283,871 $
54.7%
396,310
(1,247)
(1,374)
(748)
(215,252)
1,118
724
179,531
159,812
35,475
195,287
91.9%
43View entire presentation