J.P.Morgan 2Q23 Investor Results
JPMORGAN CHASE & CO.
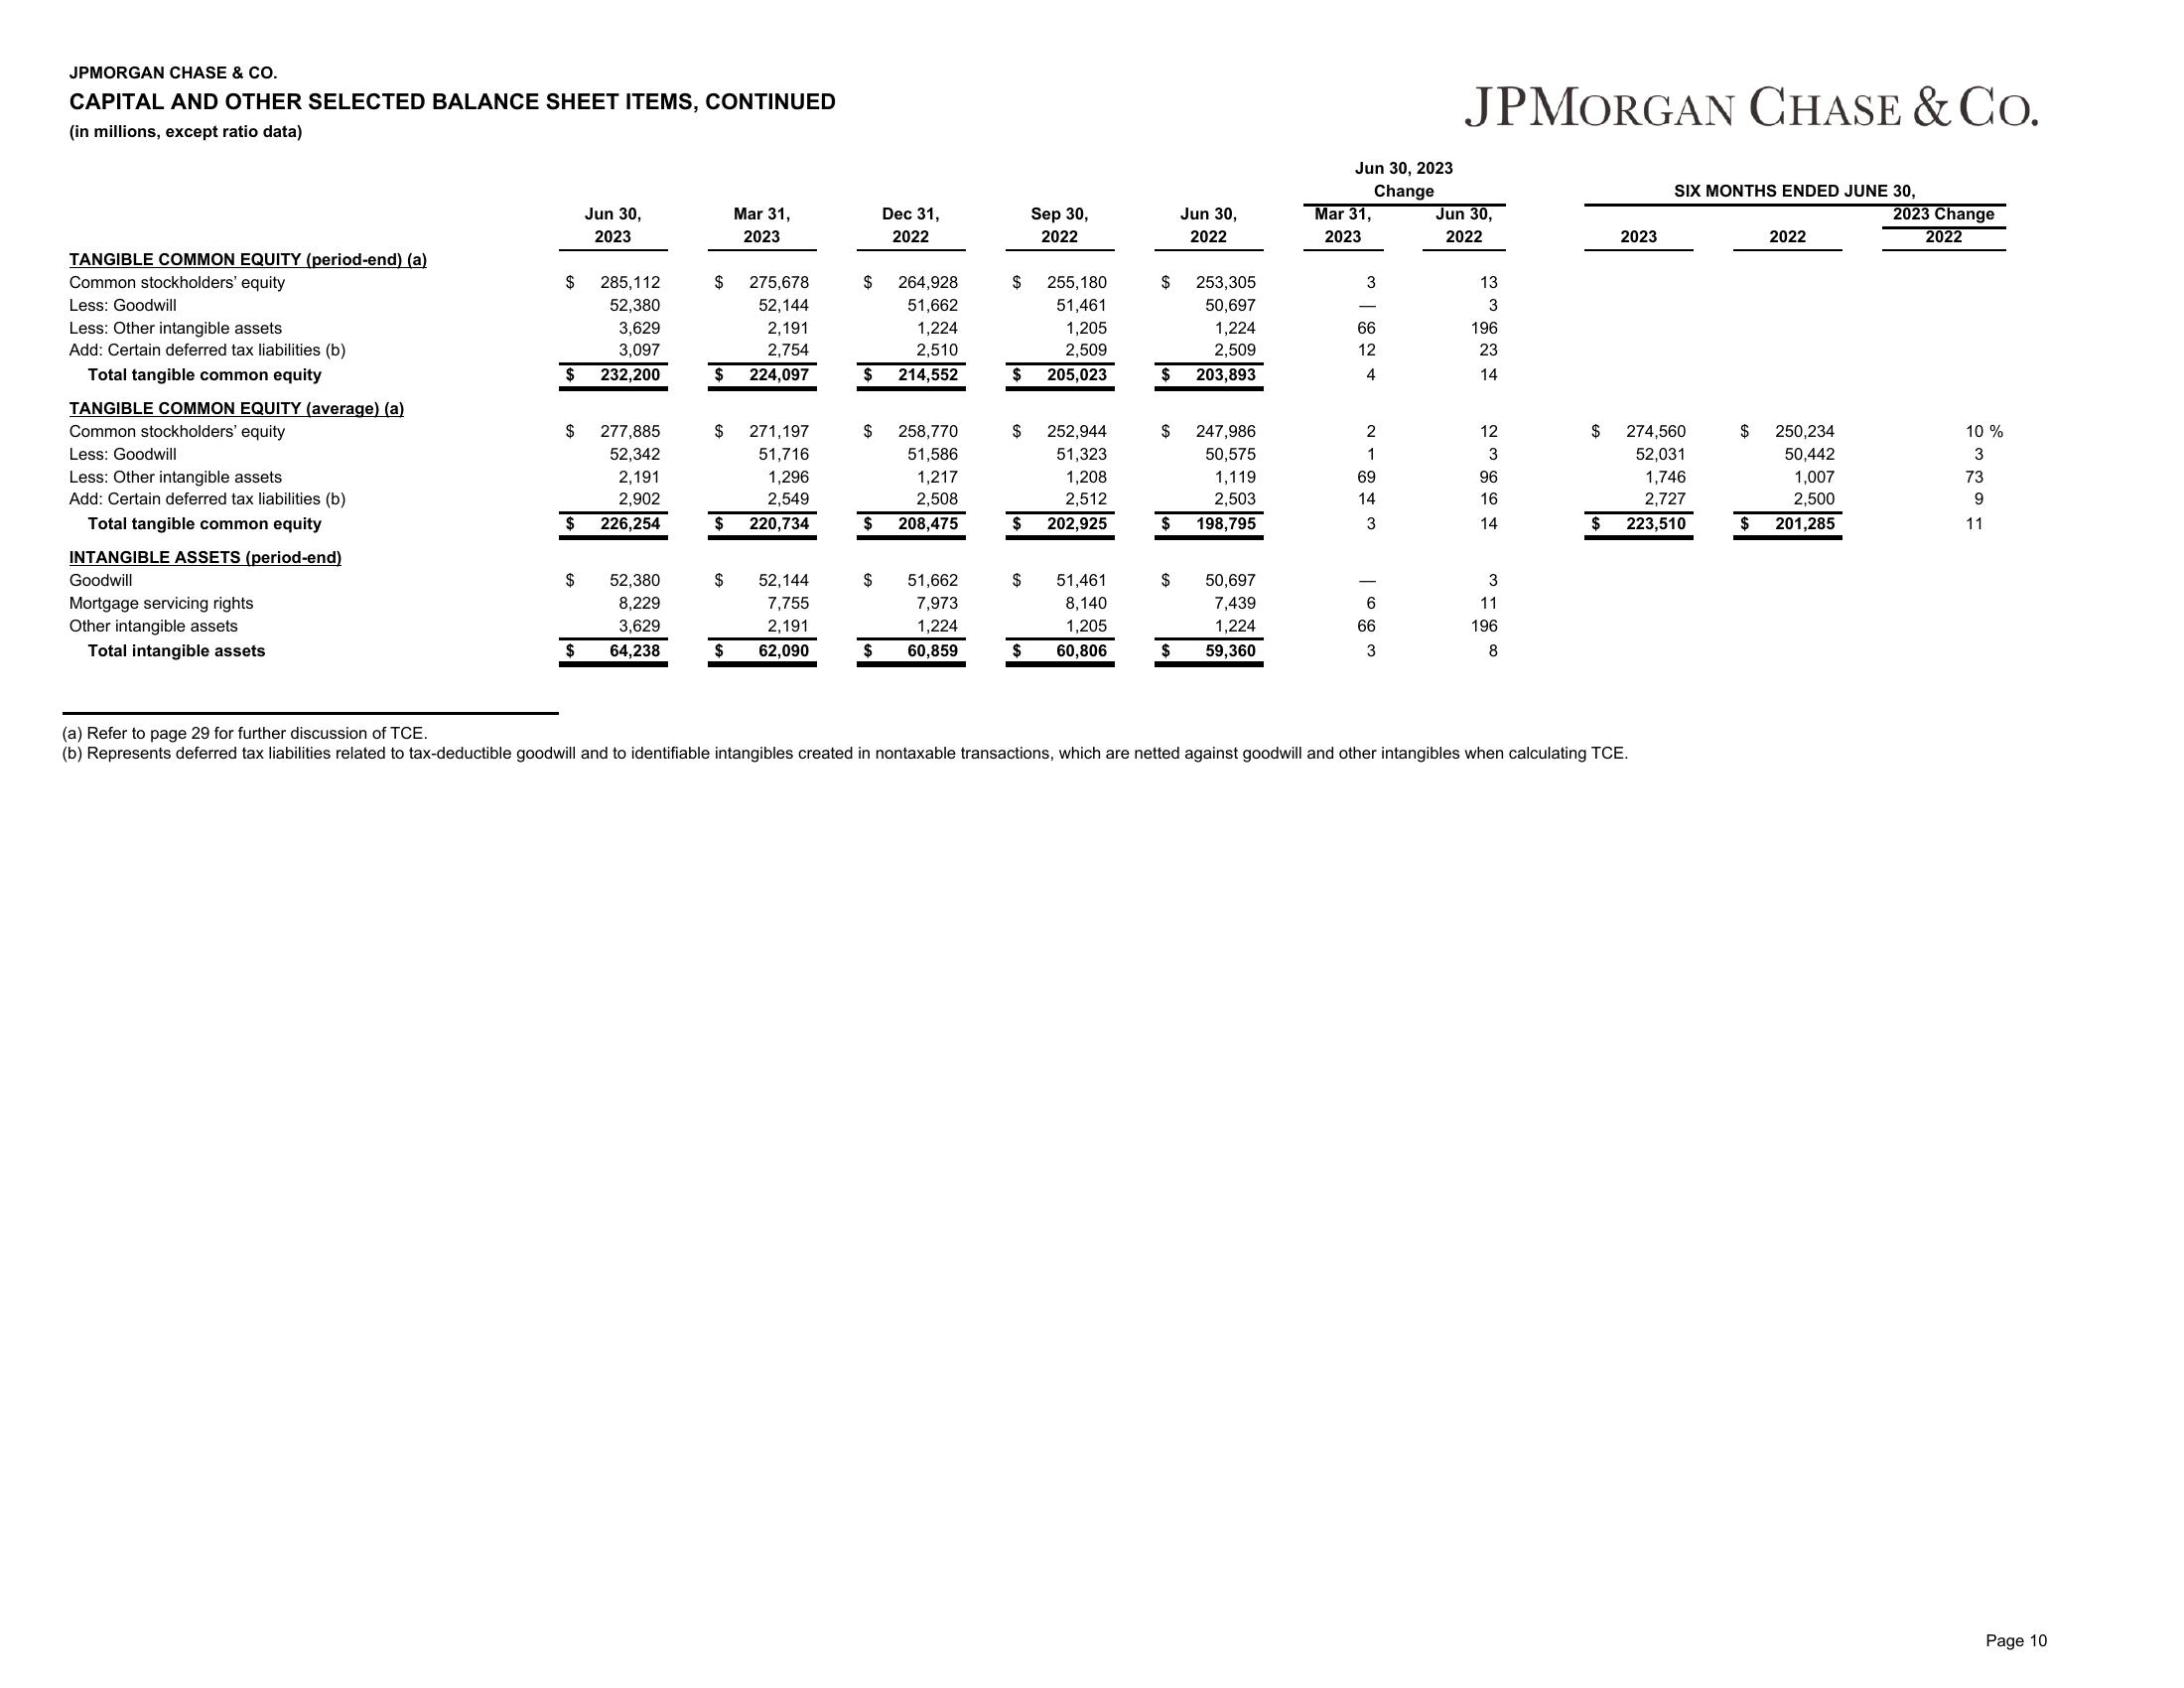
CAPITAL AND OTHER SELECTED BALANCE SHEET ITEMS, CONTINUED
(in millions, except ratio data)
TANGIBLE COMMON EQUITY (period-end) (a)
Common stockholders' equity
Less: Goodwill
Less: Other intangible assets
Add: Certain deferred tax liabilities (b)
Total tangible common equity
TANGIBLE COMMON EQUITY (average) (a)
Common stockholders' equity
Less: Goodwill
Less: Other intangible assets
Add: Certain deferred tax liabilities (b)
Total tangible common equity
INTANGIBLE ASSETS (period-end)
Goodwill
Mortgage servicing rights
Other intangible assets
Total intangible assets
$
$
$
$
$
$
Jun 30,
2023
285,112
52,380
3,629
3,097
232,200
277,885
52,342
2,191
2,902
226,254
52,380
8,229
3,629
64,238
$
$
$
$
$
Mar 31,
2023
275,678
52,144
2,191
2,754
224,097
271,197
51,716
1,296
2,549
220,734
52,144
7,755
2,191
$ 62,090
$
$
$
$
$
$
Dec 31,
2022
264,928
51,662
1,224
2,510
214,552
258,770
51,586
1,217
2,508
208,475
51,662
7,973
1,224
60,859
$
$
$
$
$
$
Sep 30,
2022
255,180
51,461
1,205
2,509
205,023
252,944
51,323
1,208
2,512
202,925
51,461
8,140
1,205
60,806
$
$
$
$
$
$
Jun 30,
2022
253,305
50,697
1,224
2,509
203,893
247,986
50,575
1,119
2,503
198,795
50,697
7,439
1,224
59,360
Jun 30, 2023
Change
Mar 31,
2023
3
66
12
4
2
1
69
14
3
6
66
3
JPMORGAN CHASE & CO.
Jun 30,
2022
13
3
196
23
14
12
3
96
16
14
3
11
196
8
$
$
2023
SIX MONTHS ENDED JUNE 30,
274,560
52,031
1,746
2,727
223,510
(a) Refer to page 29 for further discussion of TCE.
(b) Represents deferred tax liabilities related to tax-deductible goodwill and to identifiable intangibles created in nontaxable transactions, which are netted against goodwill and other intangibles when calculating TCE.
$
$
2022
250,234
50,442
1,007
2,500
201,285
2023 Change
2022
10%
3
73
9
11
Page 10View entire presentation