AstraZeneca Results Presentation Deck
Oncology
Total Revenue ($m)
700
600
500
400
300
200
100
■EM
EROW
Europe
■US
Q3
5
4
37
308
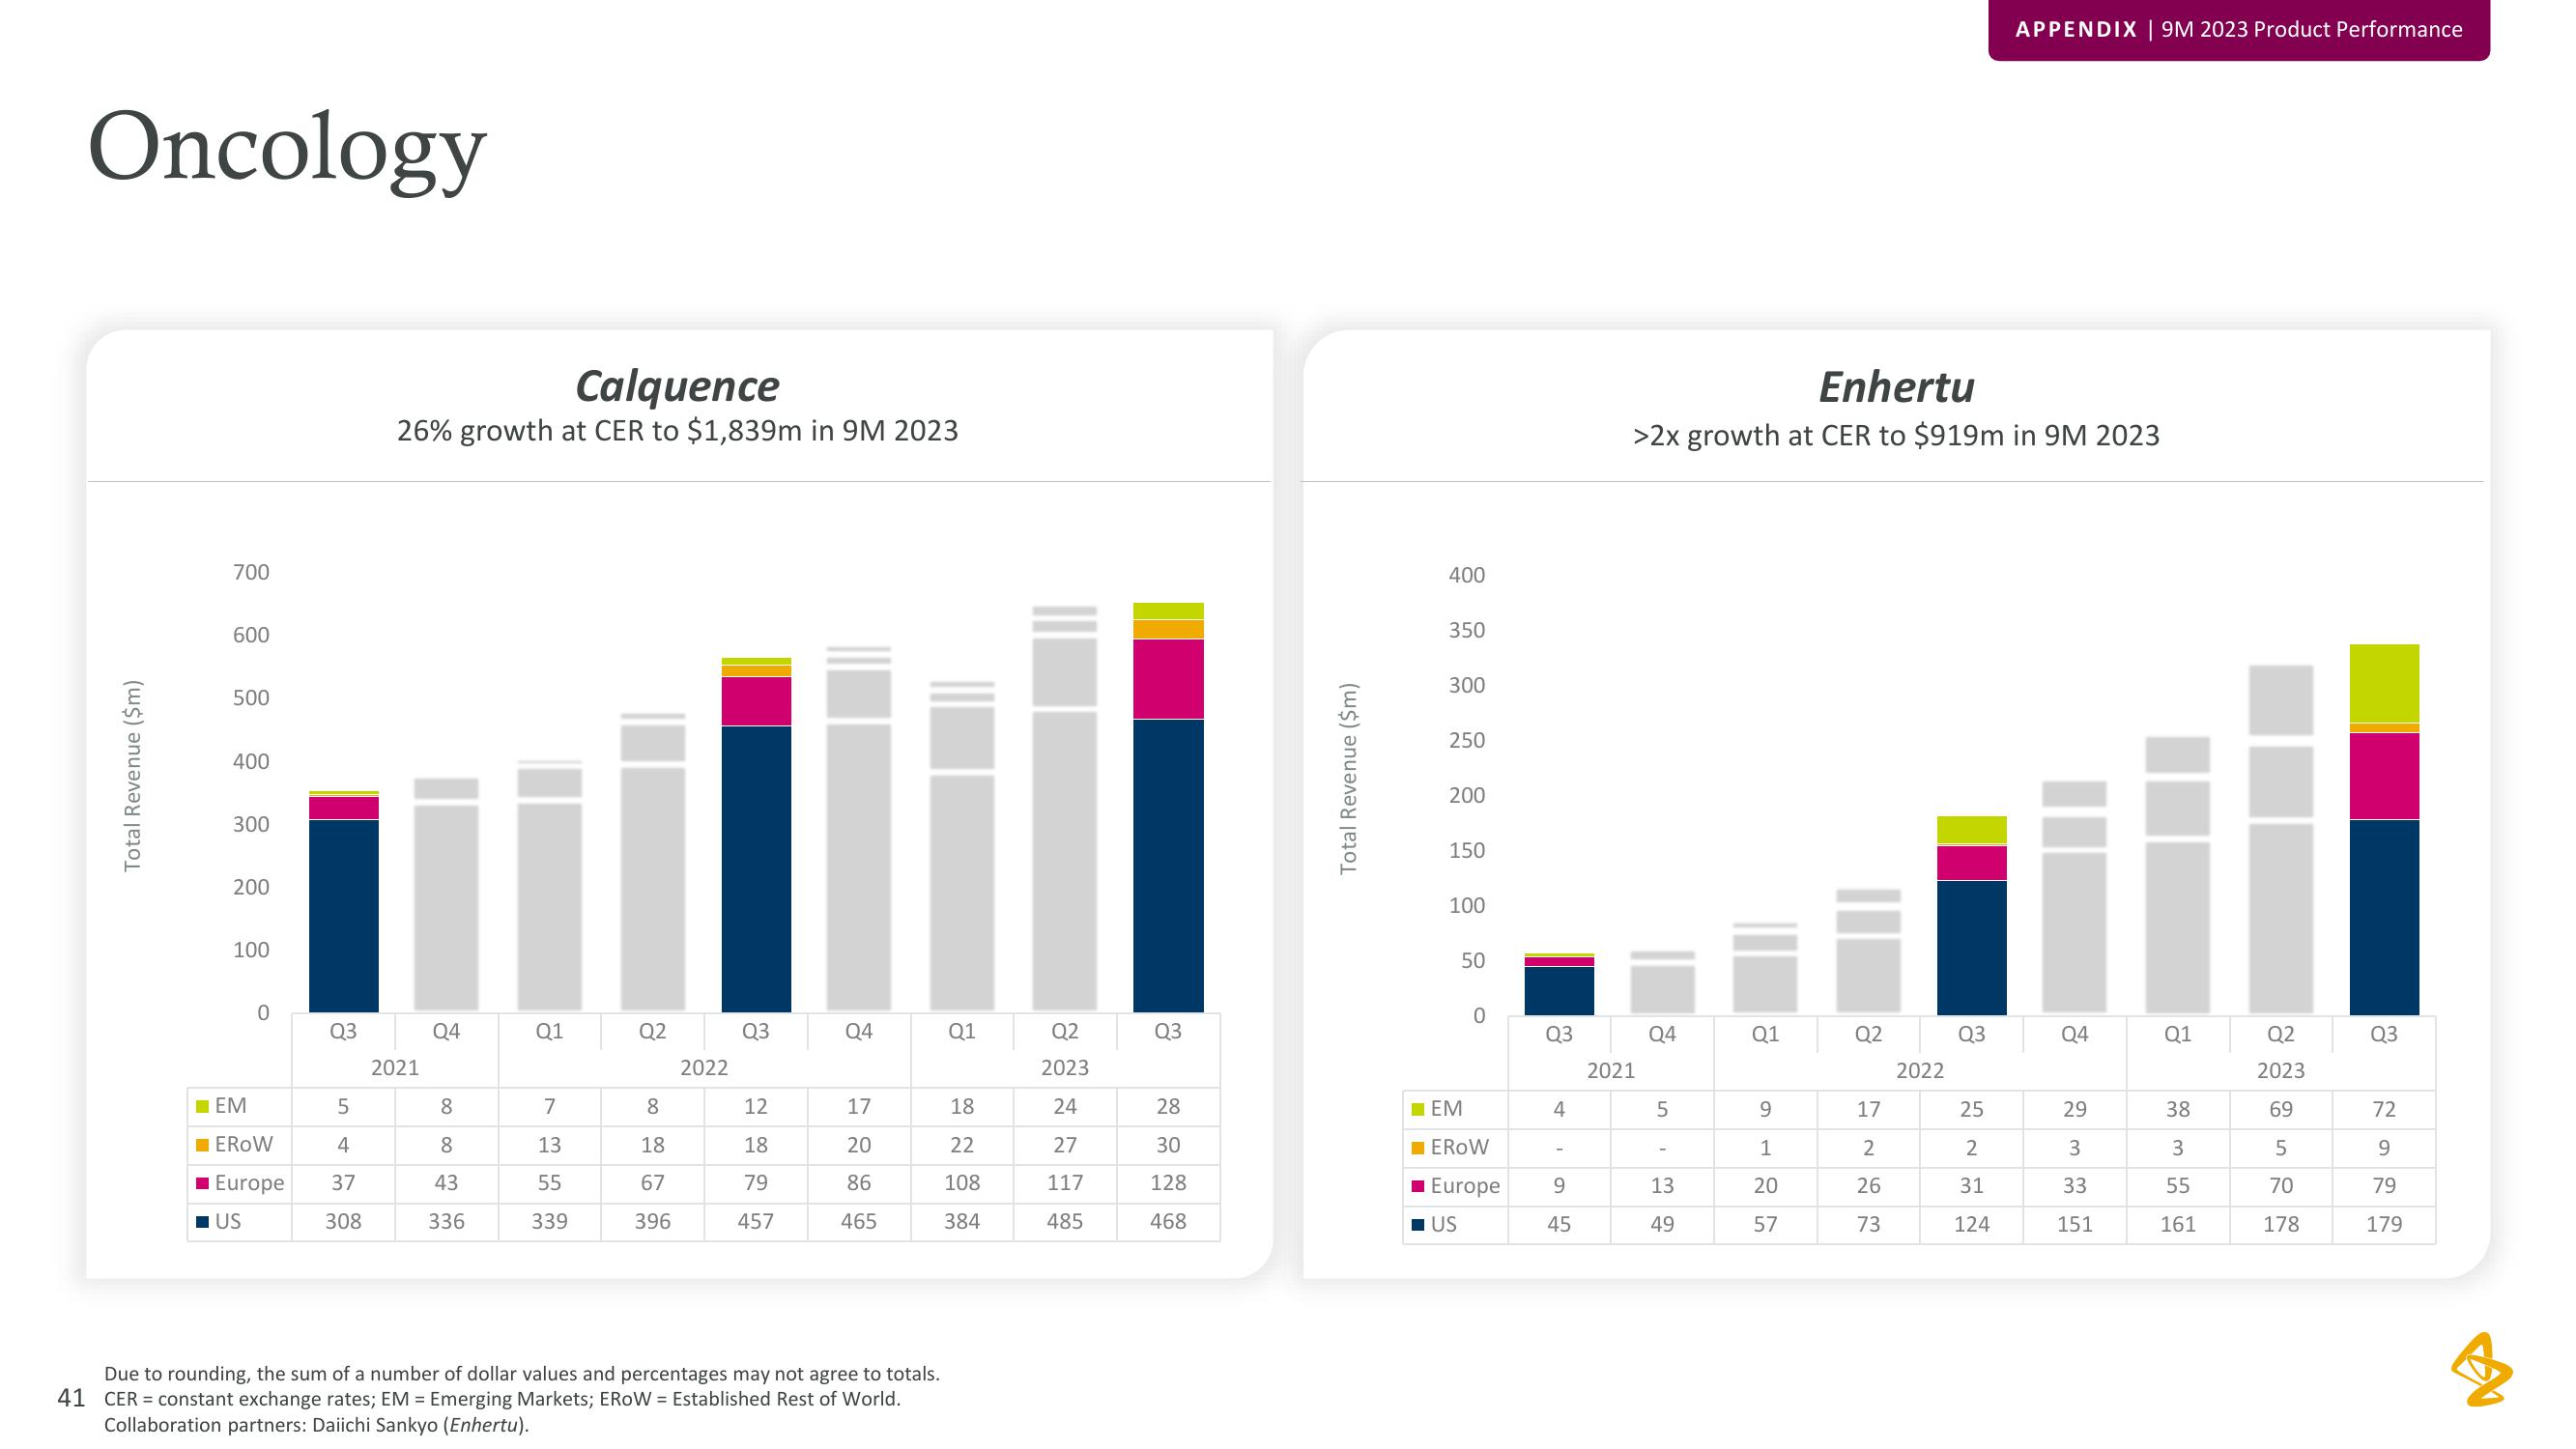
Calquence
26% growth at CER to $1,839m in 9M 2023
2021
Q4
8
8
43
336
Q1
7
13
55
339
Q2
8
18
67
396
2022
Q3
12
18
79
457
Q4
17
20
86
465
Due to rounding, the sum of a number of dollar values and percentages may not agree to totals.
41 CER = constant exchange rates; EM = Emerging Markets; EROW= Established Rest of World.
Collaboration partners: Daiichi Sankyo (Enhertu).
Q1
18
22
108
384
Q2
2023
24
27
117
485
Q3
28
30
128
468
Total Revenue ($m)
400
350
300
250
200
150
100
50
☐EM
0
EROW
■ Europe
■US
Q3
4
9
45
Enhertu
>2x growth at CER to $919m in 9M 2023
2021
Q4
5
13
49
Q1
9
1
20
57
Q2
17
2
26
73
2022
Q3
APPENDIX | 9M 2023 Product Performance
25
2
31
124
Q4
29
3
33
151
Q1
38
3
55
161
Q2
2023
69
5
70
178
Q3
72
9
79
179View entire presentation