Hydrafacial Results Presentation Deck
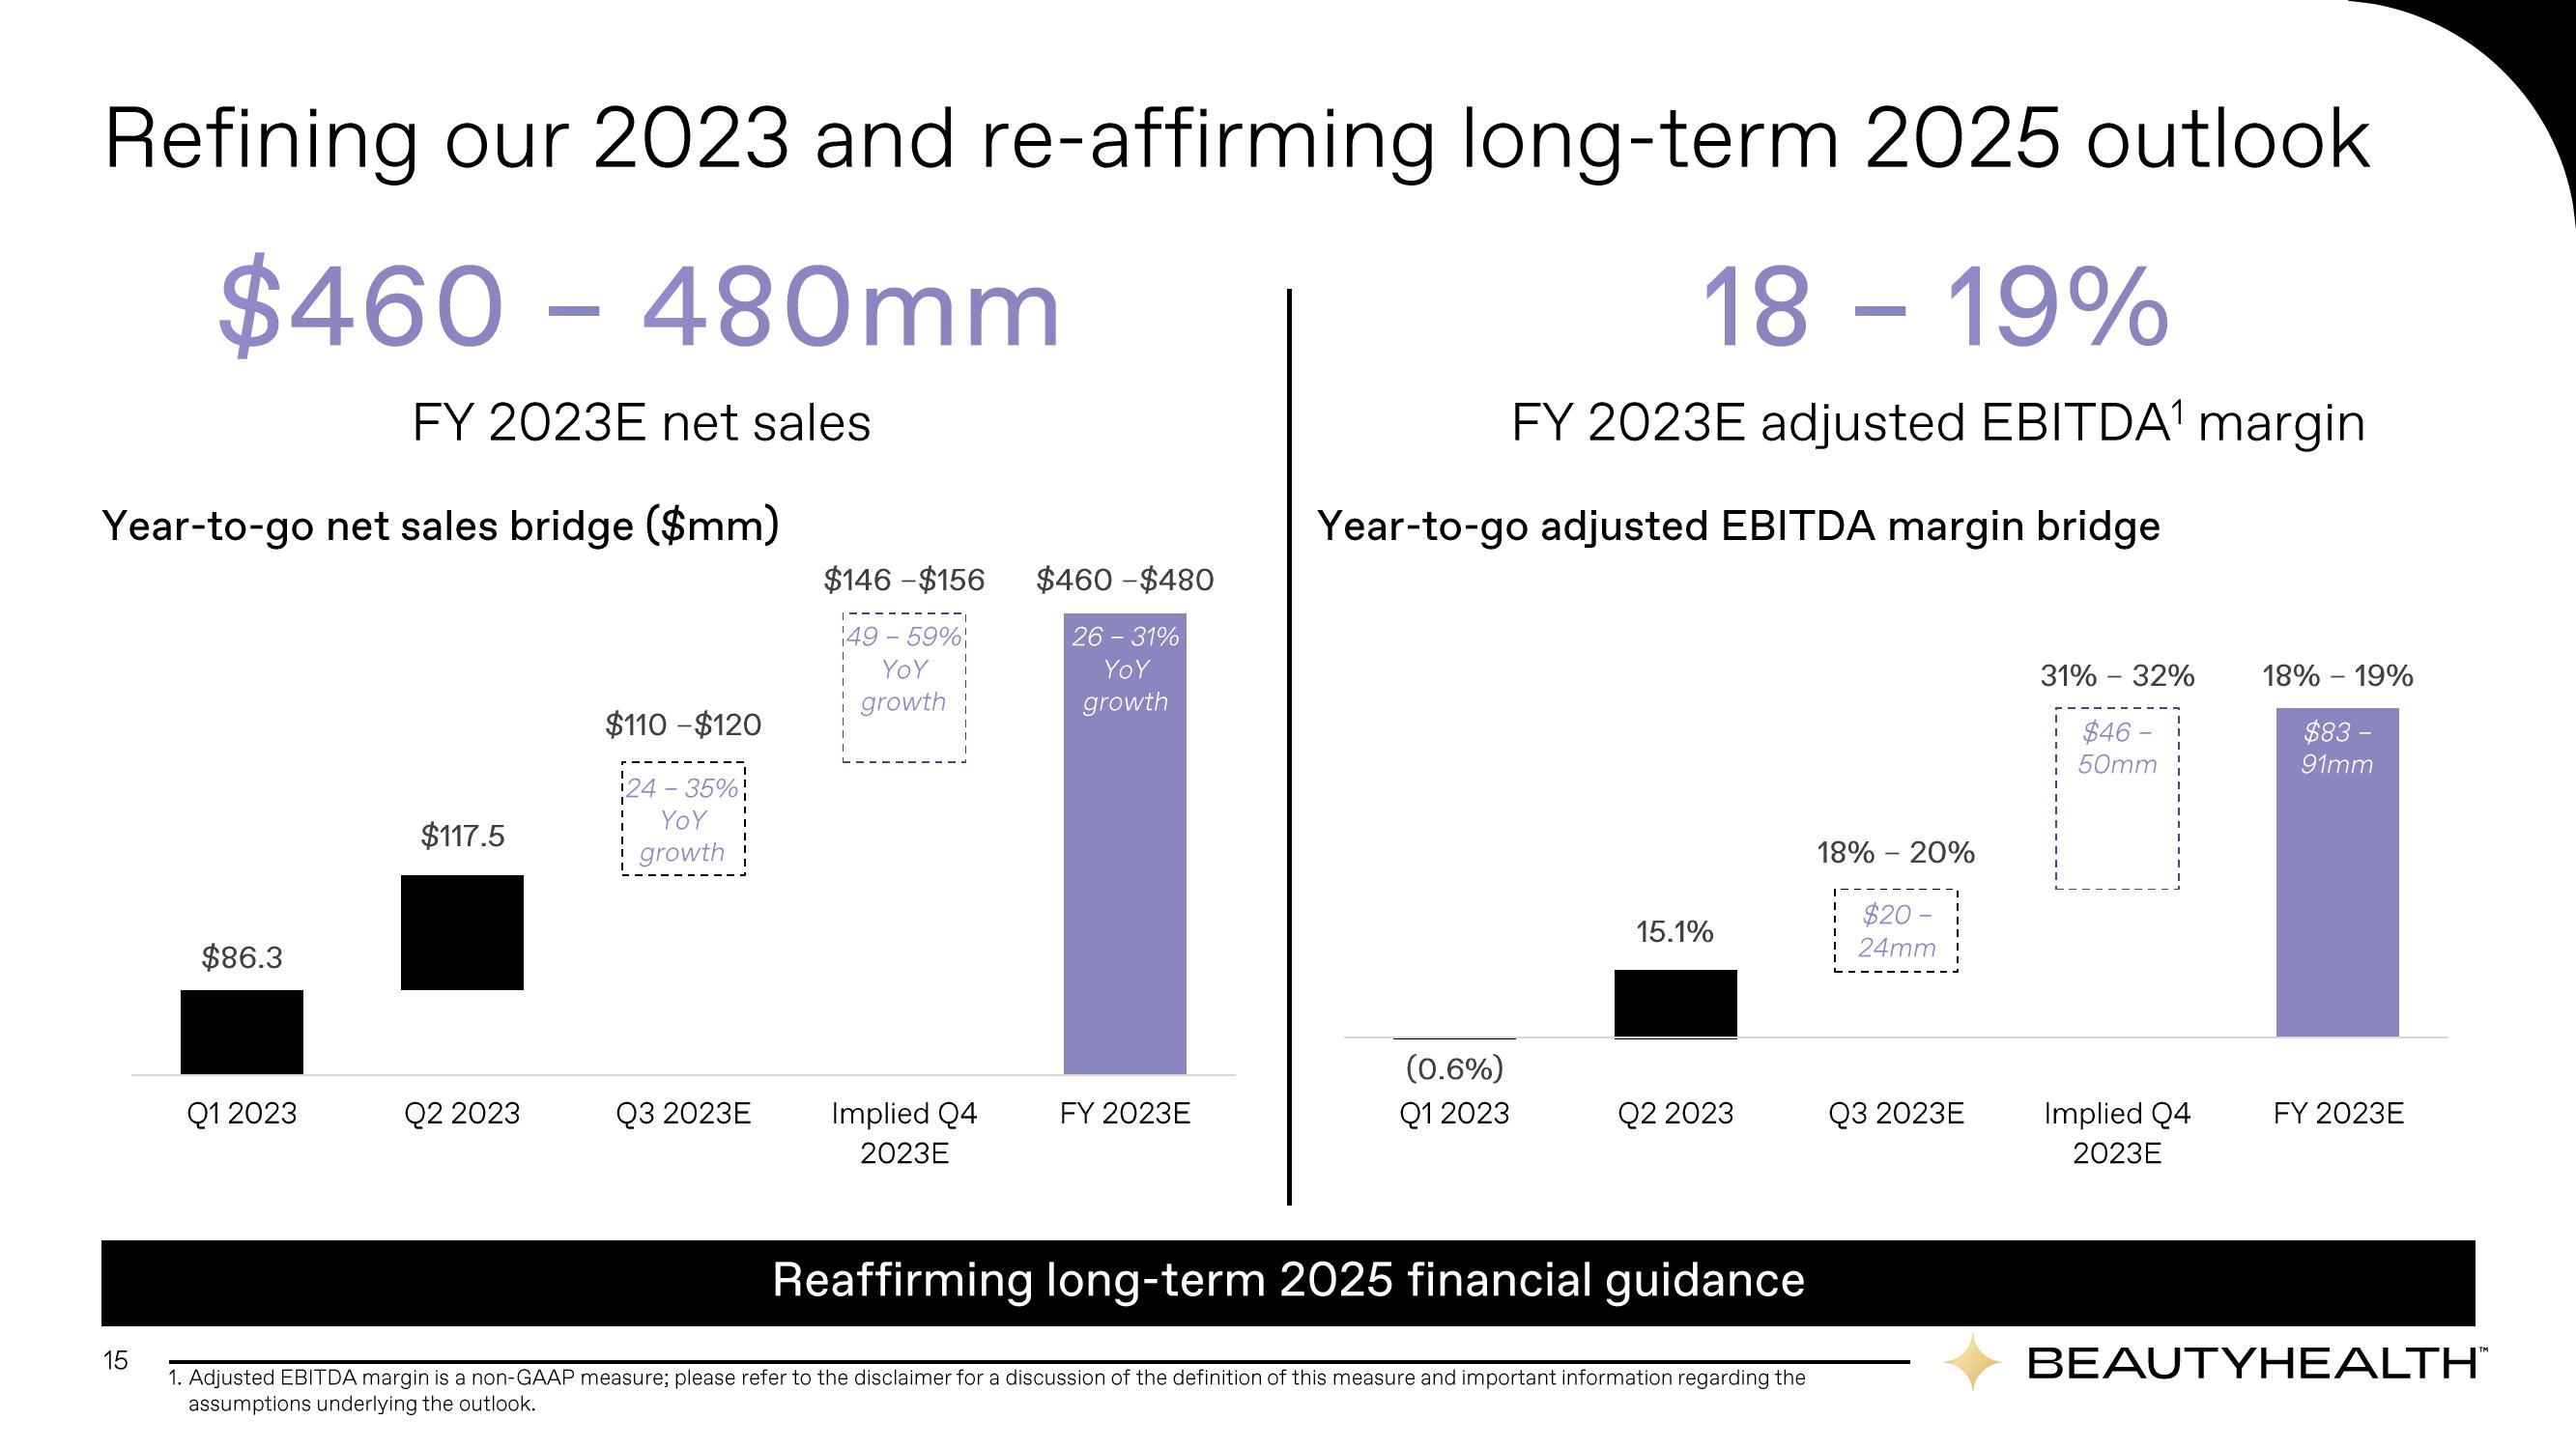
Refining our 2023 and re-affirming long-term 2025 outlook
$460-480mm
FY 2023E net sales
Year-to-go net sales bridge ($mm)
15
$86.3
Q1 2023
$117.5
Q2 2023
$110 - $120
24-35%
YoY
growth
Q3 2023E
$146 -$156
49 - 59%
YoY
growth
Implied Q4
2023E
$460-$480
26 - 31%
YoY
growth
FY 2023E
18 - 19%
FY 2023E adjusted EBITDA¹ margin
Year-to-go adjusted EBITDA margin bridge
(0.6%)
Q1 2023
15.1%
Q2 2023
Reaffirming long-term 2025 financial guidance
1. Adjusted EBITDA margin is a non-GAAP measure; please refer to the disclaimer for a discussion of the definition of this measure and important information regarding the
assumptions underlying the outlook.
18% - 20%
$20-
24mm
Q3 2023E
31% -32%
$46-
50mm
Implied Q4
2023E
18% - 19%
$83 -
91mm
FY 2023E
BEAUTYHEALTH™View entire presentation