Blend Results Presentation Deck
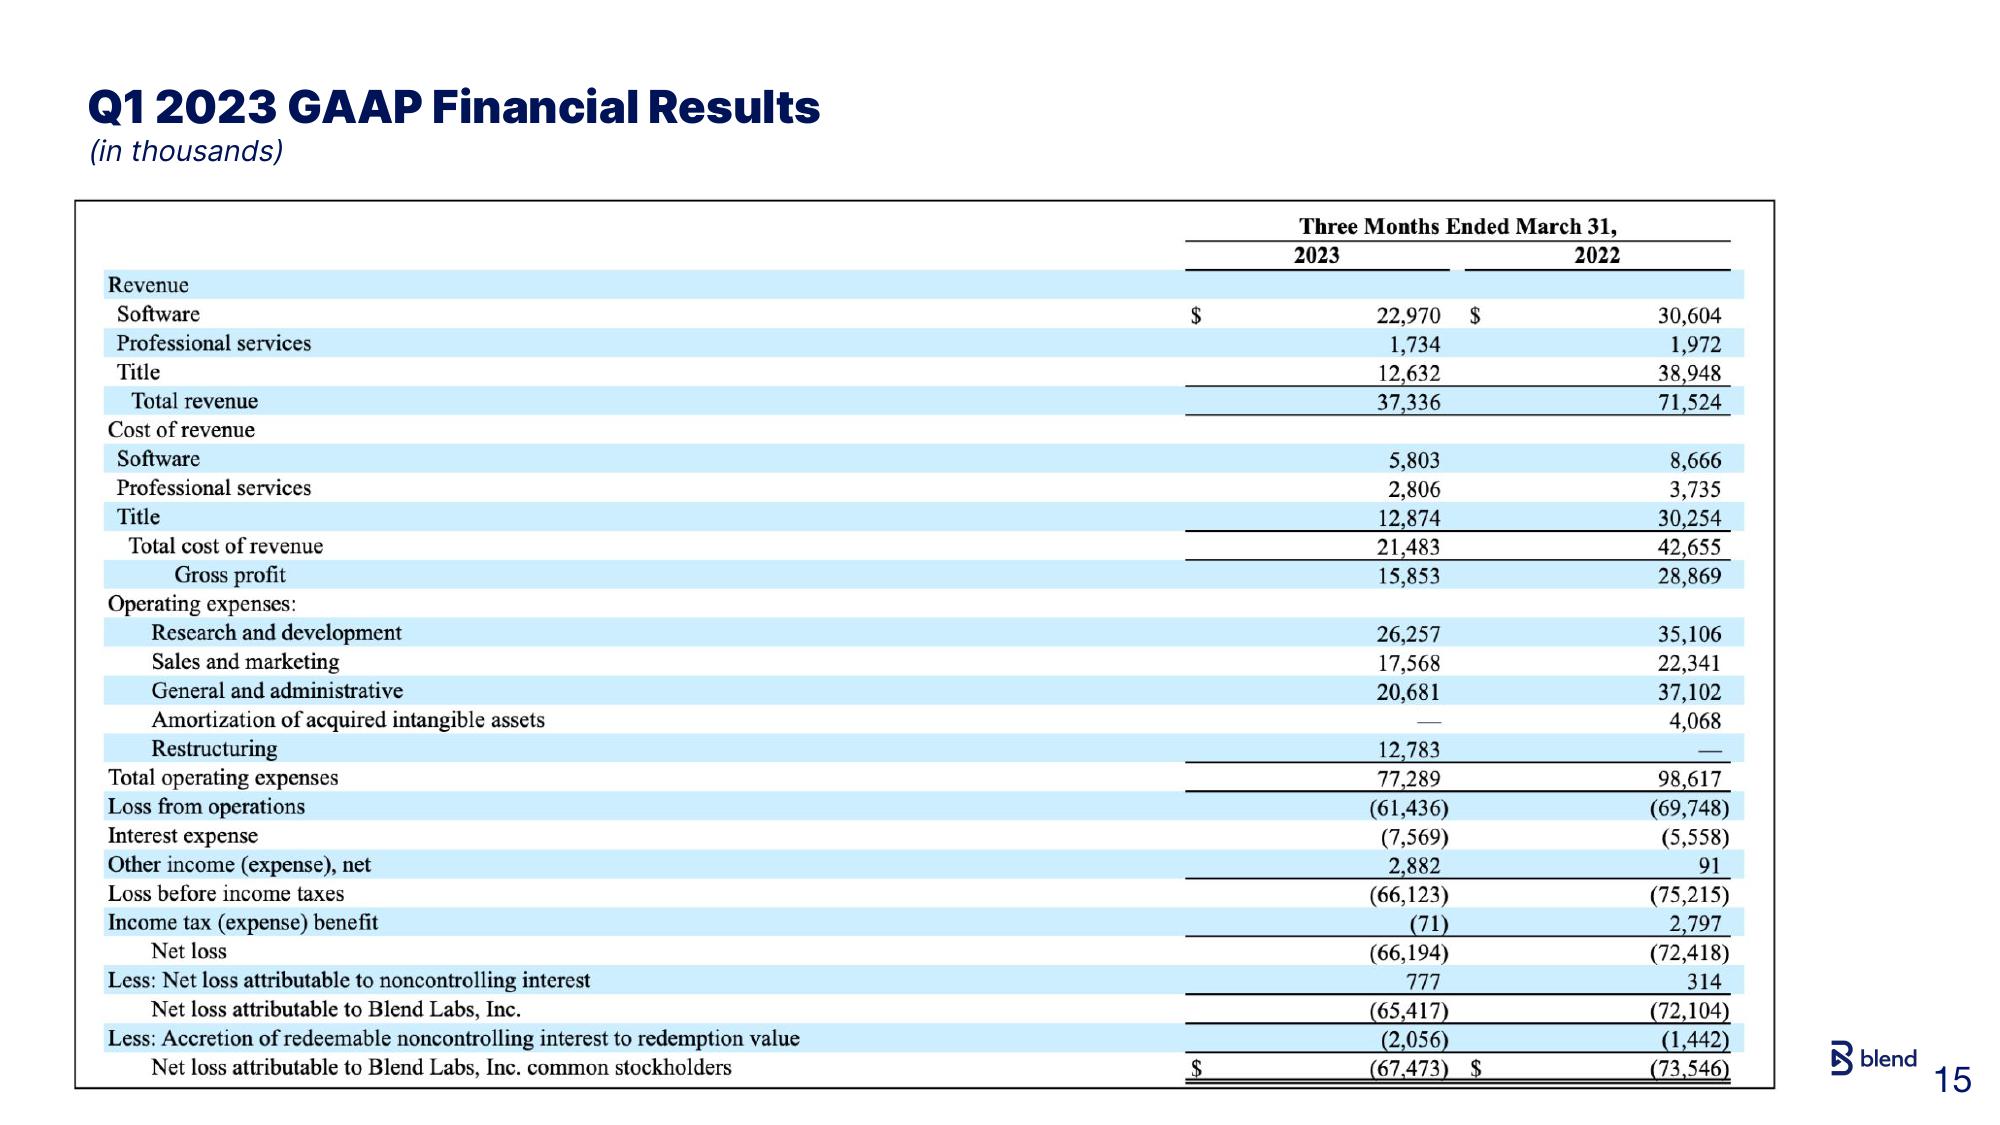
Q1 2023 GAAP Financial Results
(in thousands)
Revenue
Software
Professional services.
Title
Total revenue
Cost of revenue
Software
Professional services
Title
Total cost of revenue
Gross profit
Operating expenses:
Research and development
Sales and marketing
General and administrative
Amortization of acquired intangible assets
Restructuring
Total operating expenses
Loss from operations
Interest expense
Other income (expense), net
Loss before income taxes
Income tax (expense) benefit
Net loss
Less: Net loss attributable to noncontrolling interest
Net loss attributable to Blend Labs, Inc.
Less: Accretion of redeemable noncontrolling interest to redemption value
Net loss attributable to Blend Labs, Inc. common stockholders
$
$
Three Months Ended March 31,
2023
2022
22,970
1,734
12,632
37,336
5,803
2,806
12,874
21,483
15,853
26,257
17,568
20,681
$
12,783
77,289
(61,436)
(7,569)
2,882
(66,123)
(71)
(66,194)
777
(65,417)
(2,056)
(67,473) $
30,604
1,972
38,948
71,524
8,666
3,735
30,254
42,655
28,869
35,106
22,341
37,102
4,068
98,617
(69,748)
(5,558)
91
(75,215)
2,797
(72,418)
314
(72,104)
(1,442)
(73,546)
blend
15View entire presentation