BAT Results Presentation Deck slide image

BAT Results Presentation Deck

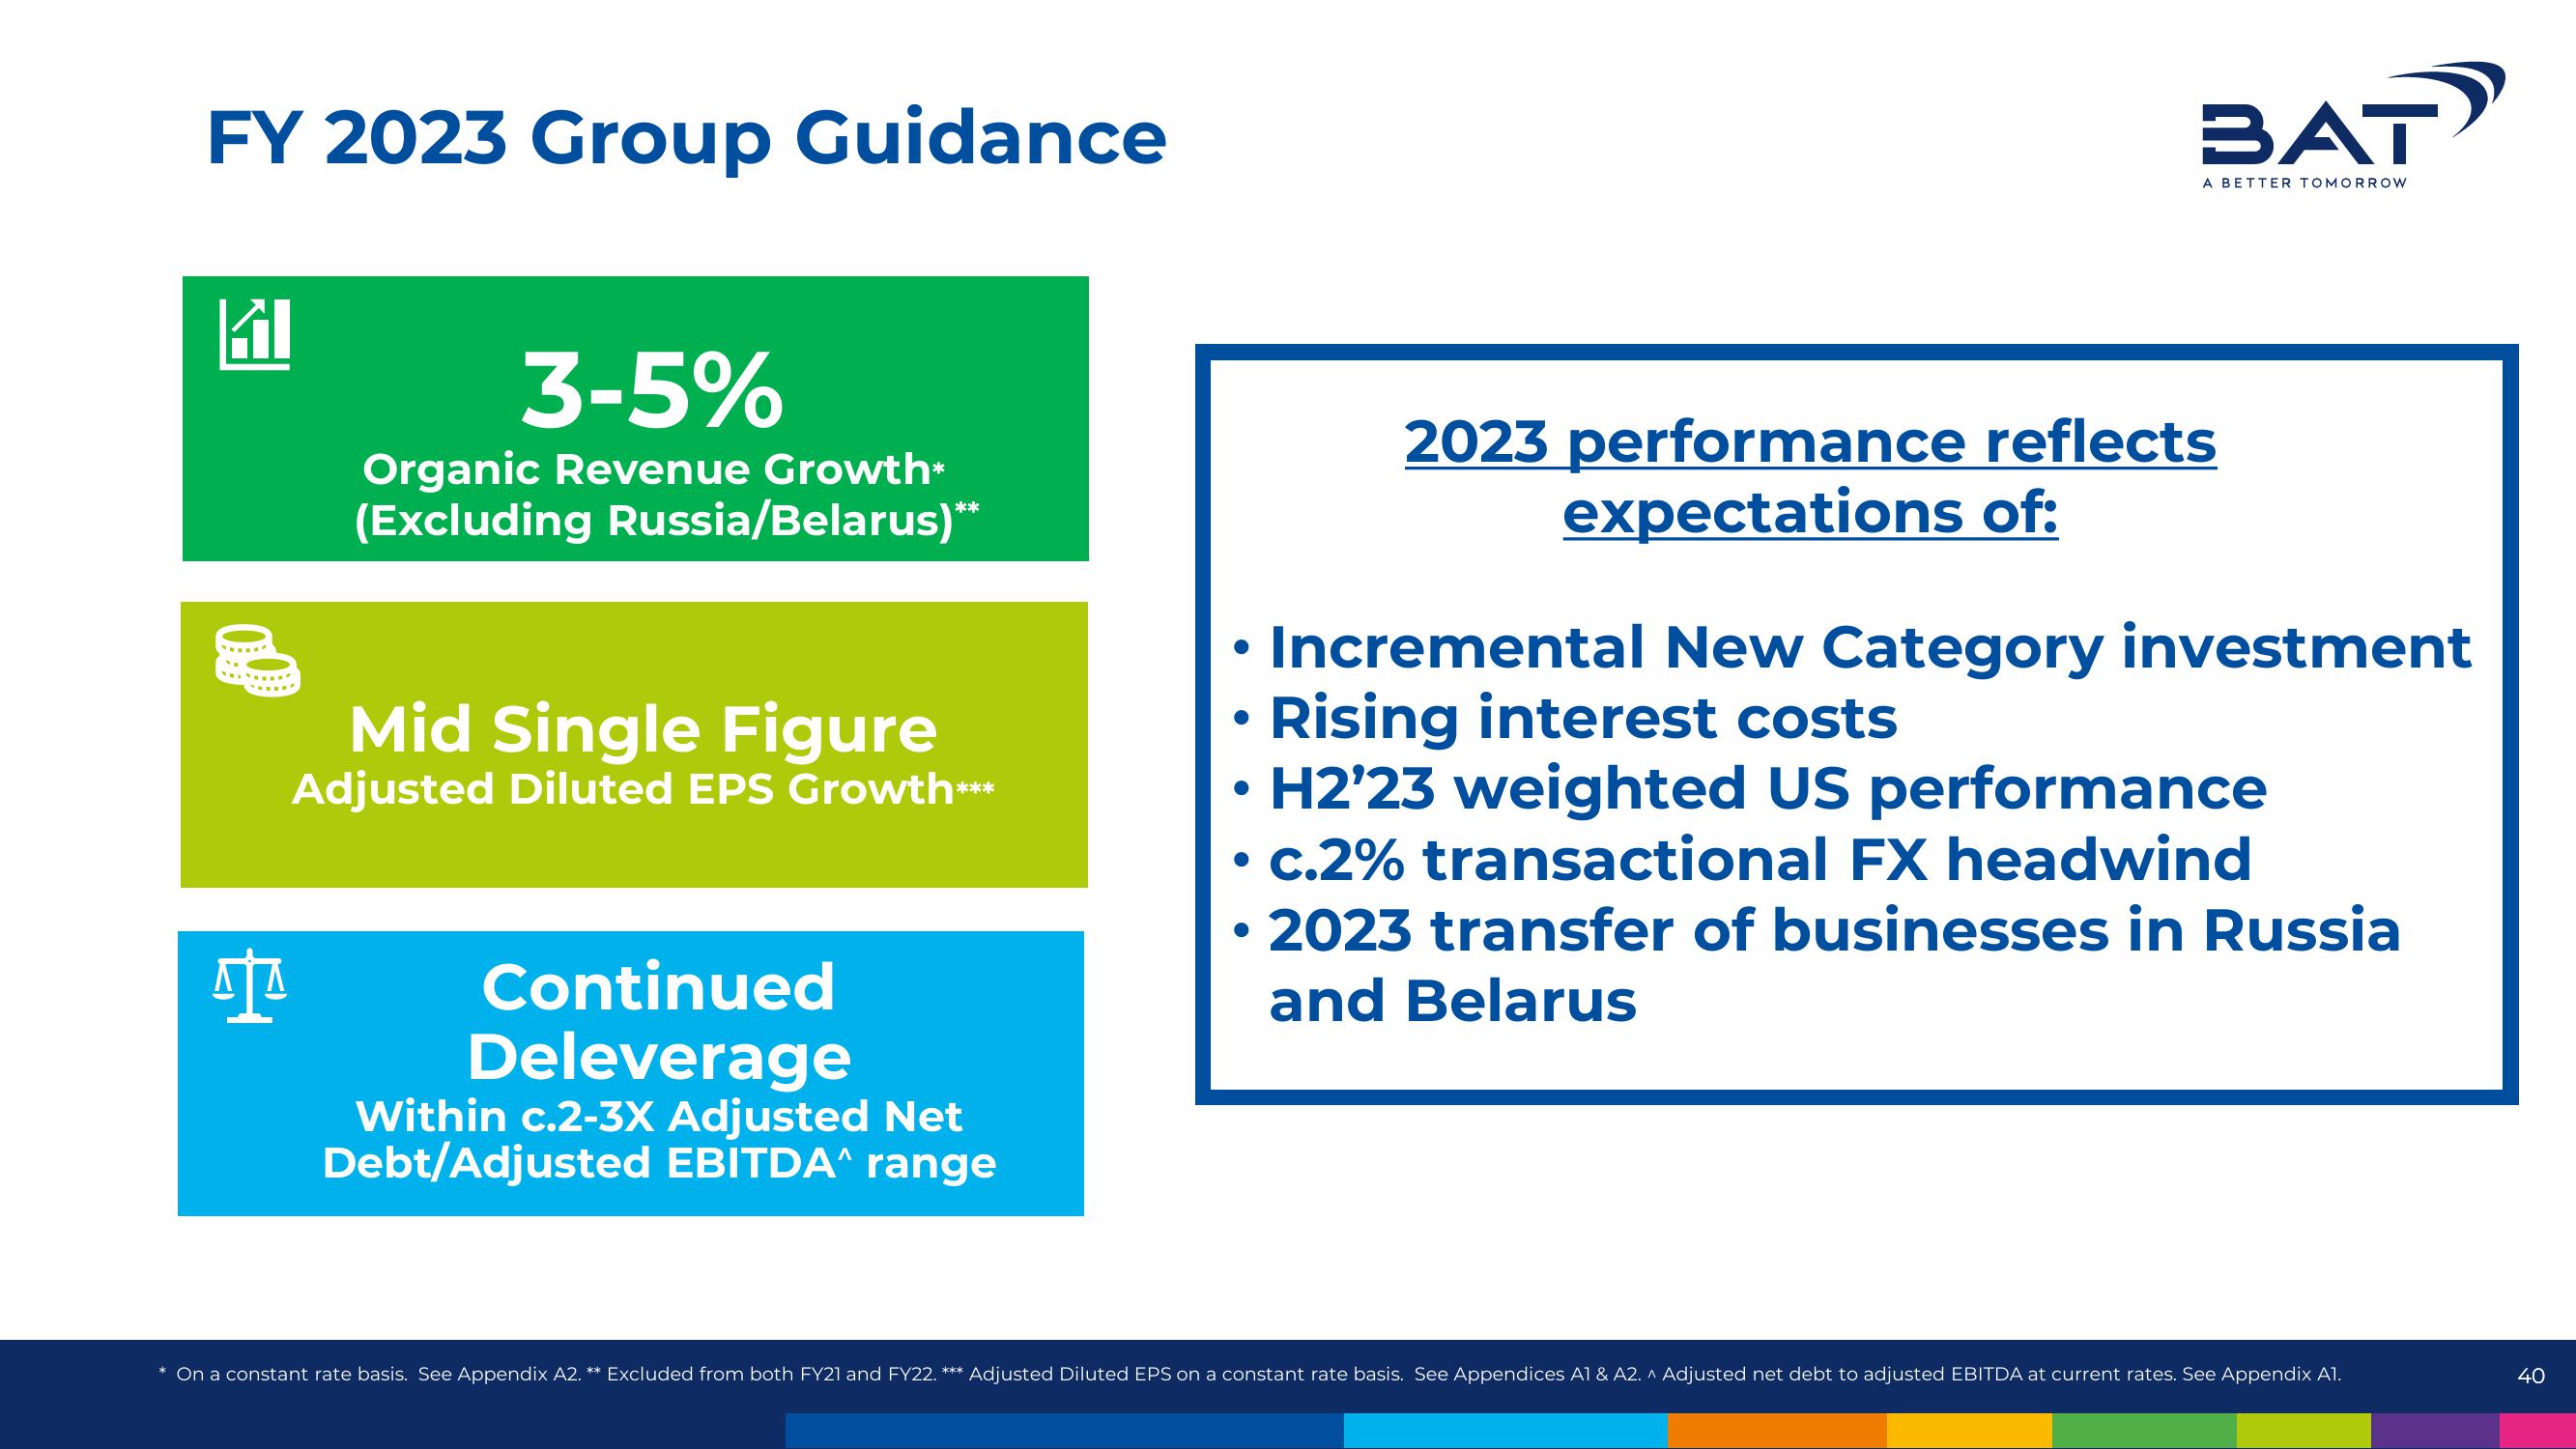
FY 2023 Group Guidance E 3-5% Organic Revenue Growth* (Excluding Russia/Belarus)** Mid Single Figure Adjusted Diluted EPS Growth** Continued Deleverage *** Within c.2-3X Adjusted Net Debt/Adjusted EBITDA^ range ā— ā— BAT A BETTER TOMORROW 2023 performance reflects expectations of: Incremental New Category investment Rising interest costs H2'23 weighted US performance c.2% transactional FX headwind 2023 transfer of businesses in Russia and Belarus On a constant rate basis. See Appendix A2. ** Excluded from both FY21 and FY22. *** Adjusted Diluted EPS on a constant rate basis. See Appendices A1 & A2. ^ Adjusted net debt to adjusted EBITDA at current rates. See Appendix A1. 40
View entire presentation