Bed Bath & Beyond Results Presentation Deck
FINANCIAL OUTLOOK
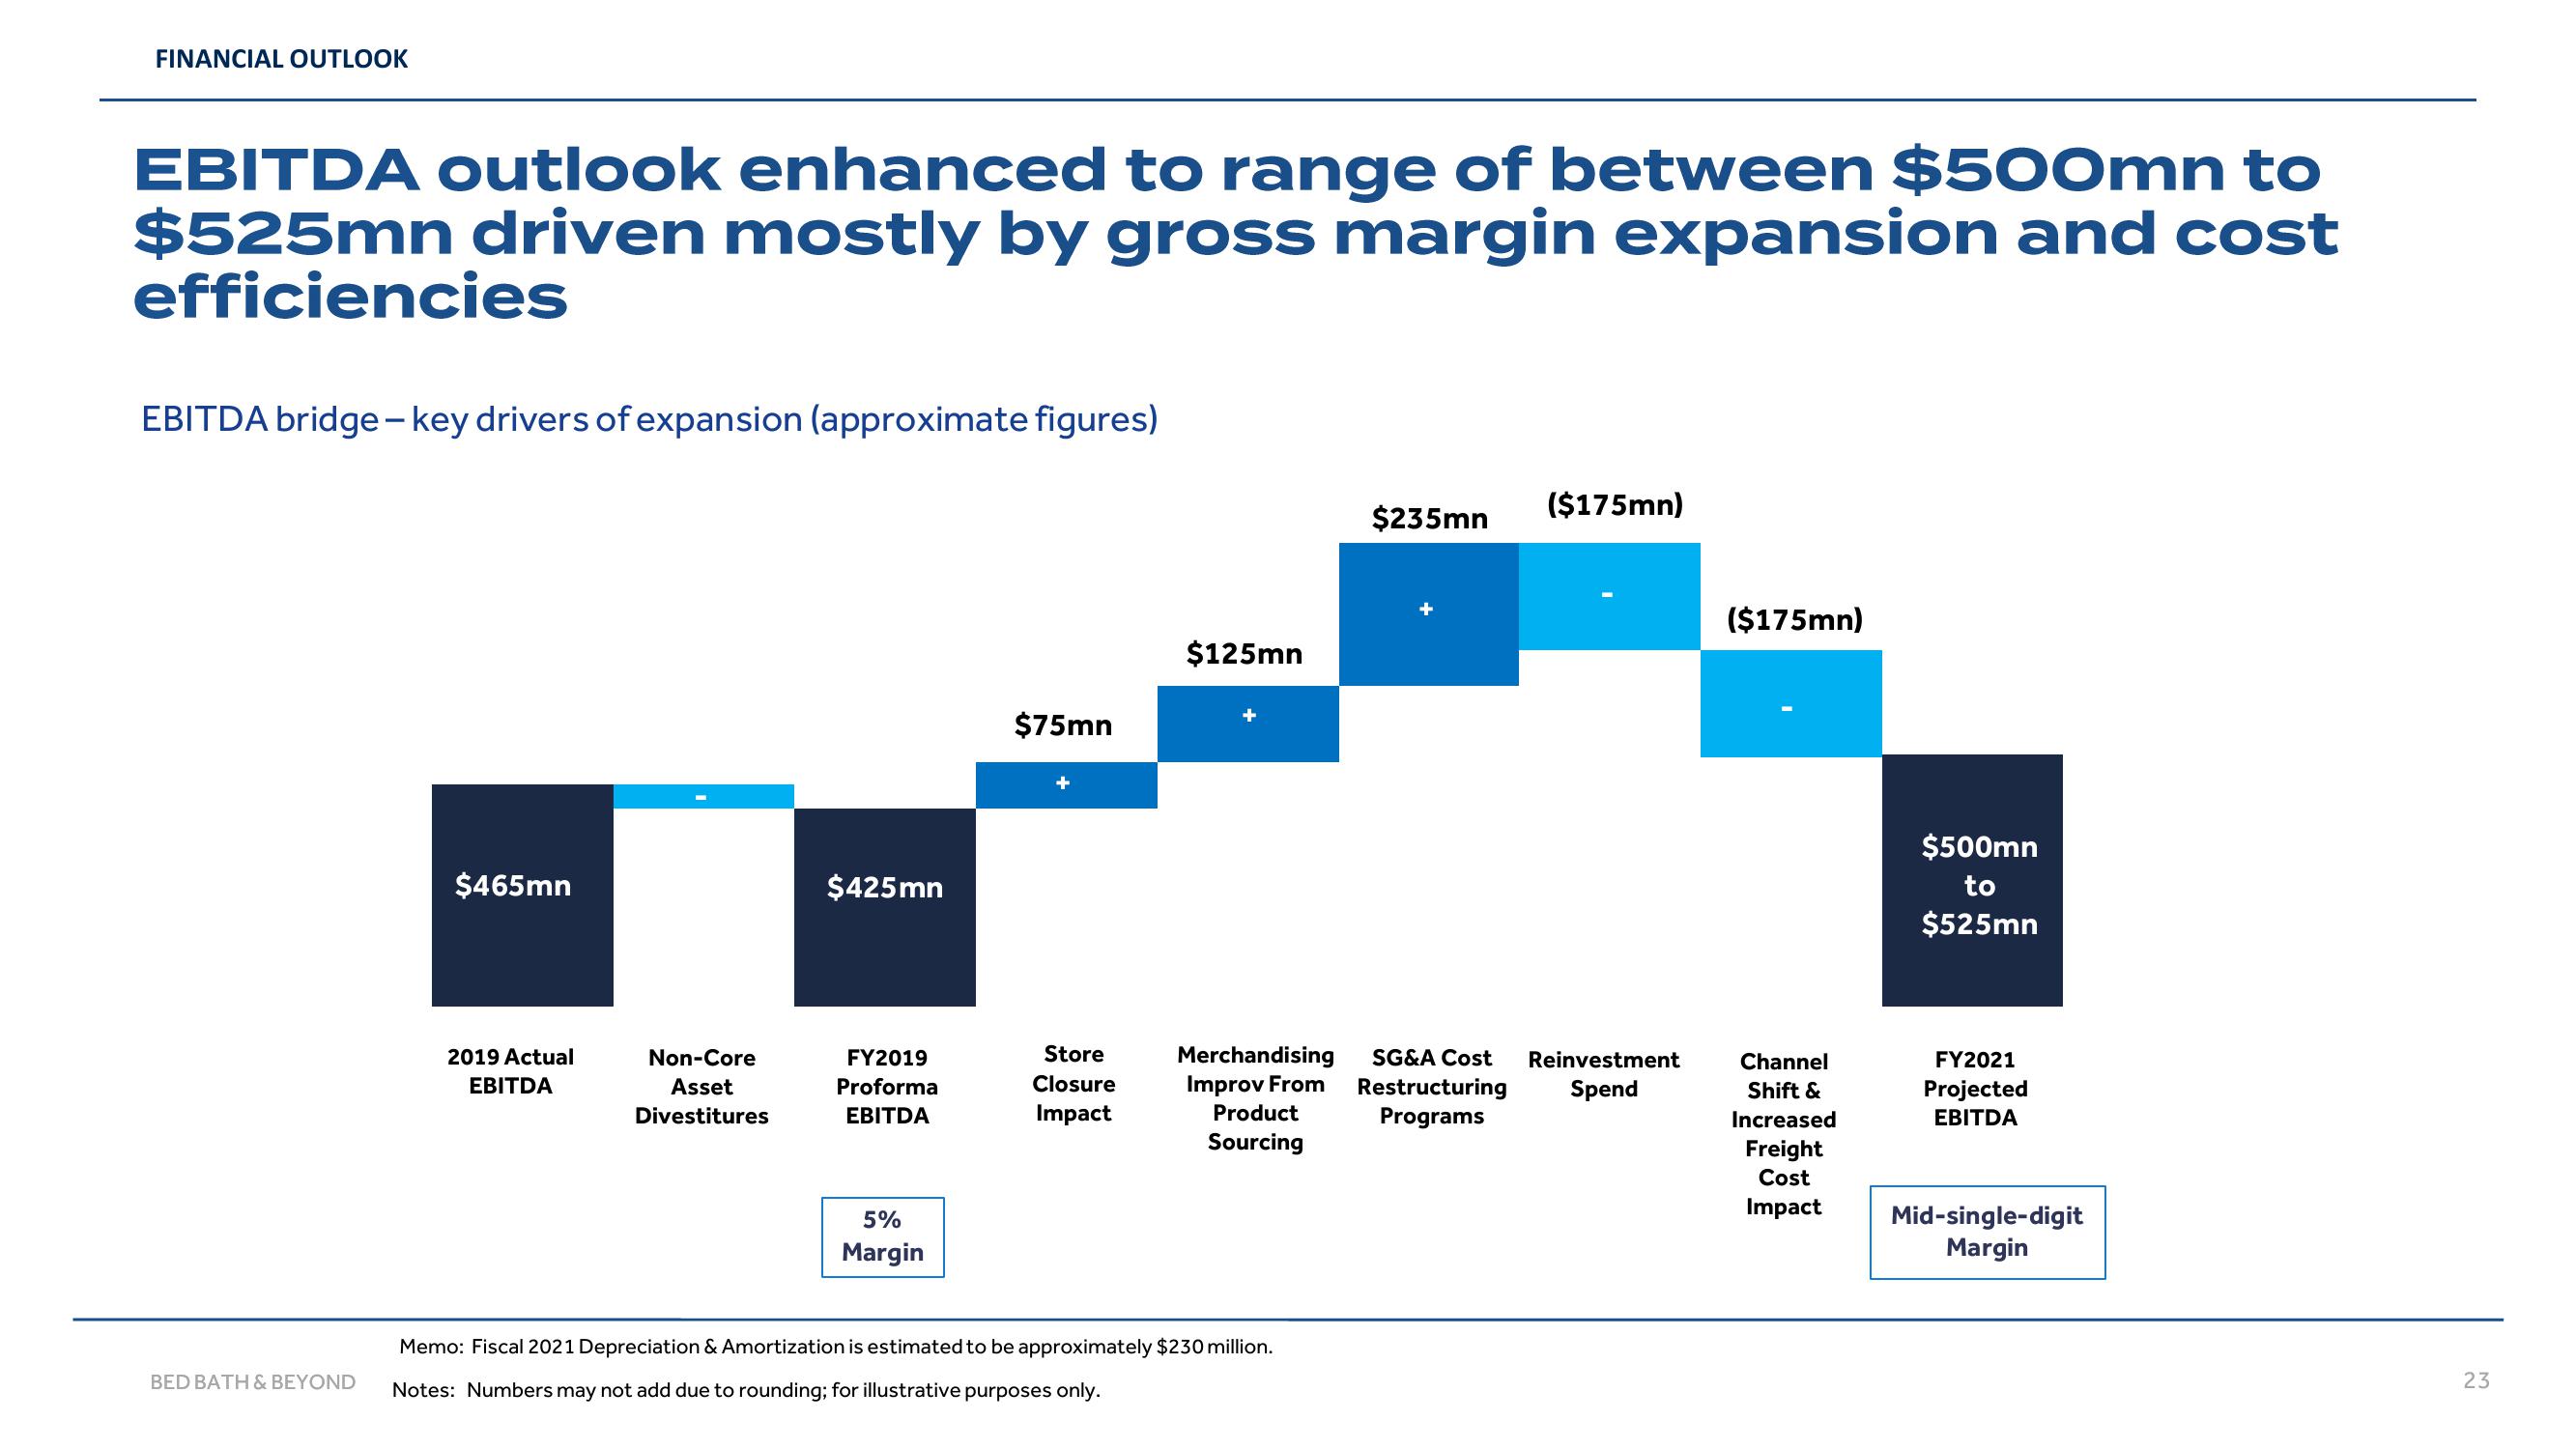
EBITDA outlook enhanced to range of between $500mn to
$525mn driven mostly by gross margin expansion and cost
efficiencies
EBITDA bridge-key drivers of expansion (approximate figures)
BED BATH & BEYOND
$465mn
2019 Actual
EBITDA
Non-Core
Asset
Divestitures
$425mn
FY2019
Proforma
EBITDA
5%
Margin
$75mn
Store
Closure
Impact
$125mn
Product
Sourcing
$235mn
Merchandising SG&A Cost Reinvestment
Improv From Restructuring Spend
Programs
Memo: Fiscal 2021 Depreciation & Amortization is estimated to be approximately $230 million.
Notes: Numbers may not add due to rounding; for illustrative purposes only.
($175mn)
($175mn)
Channel
Shift &
Increased
Freight
Cost
Impact
$500mn
to
$525mn
FY2021
Projected
EBITDA
Mid-single-digit
Margin
23View entire presentation