Granite Ridge Investor Presentation Deck slide image

Granite Ridge Investor Presentation Deck

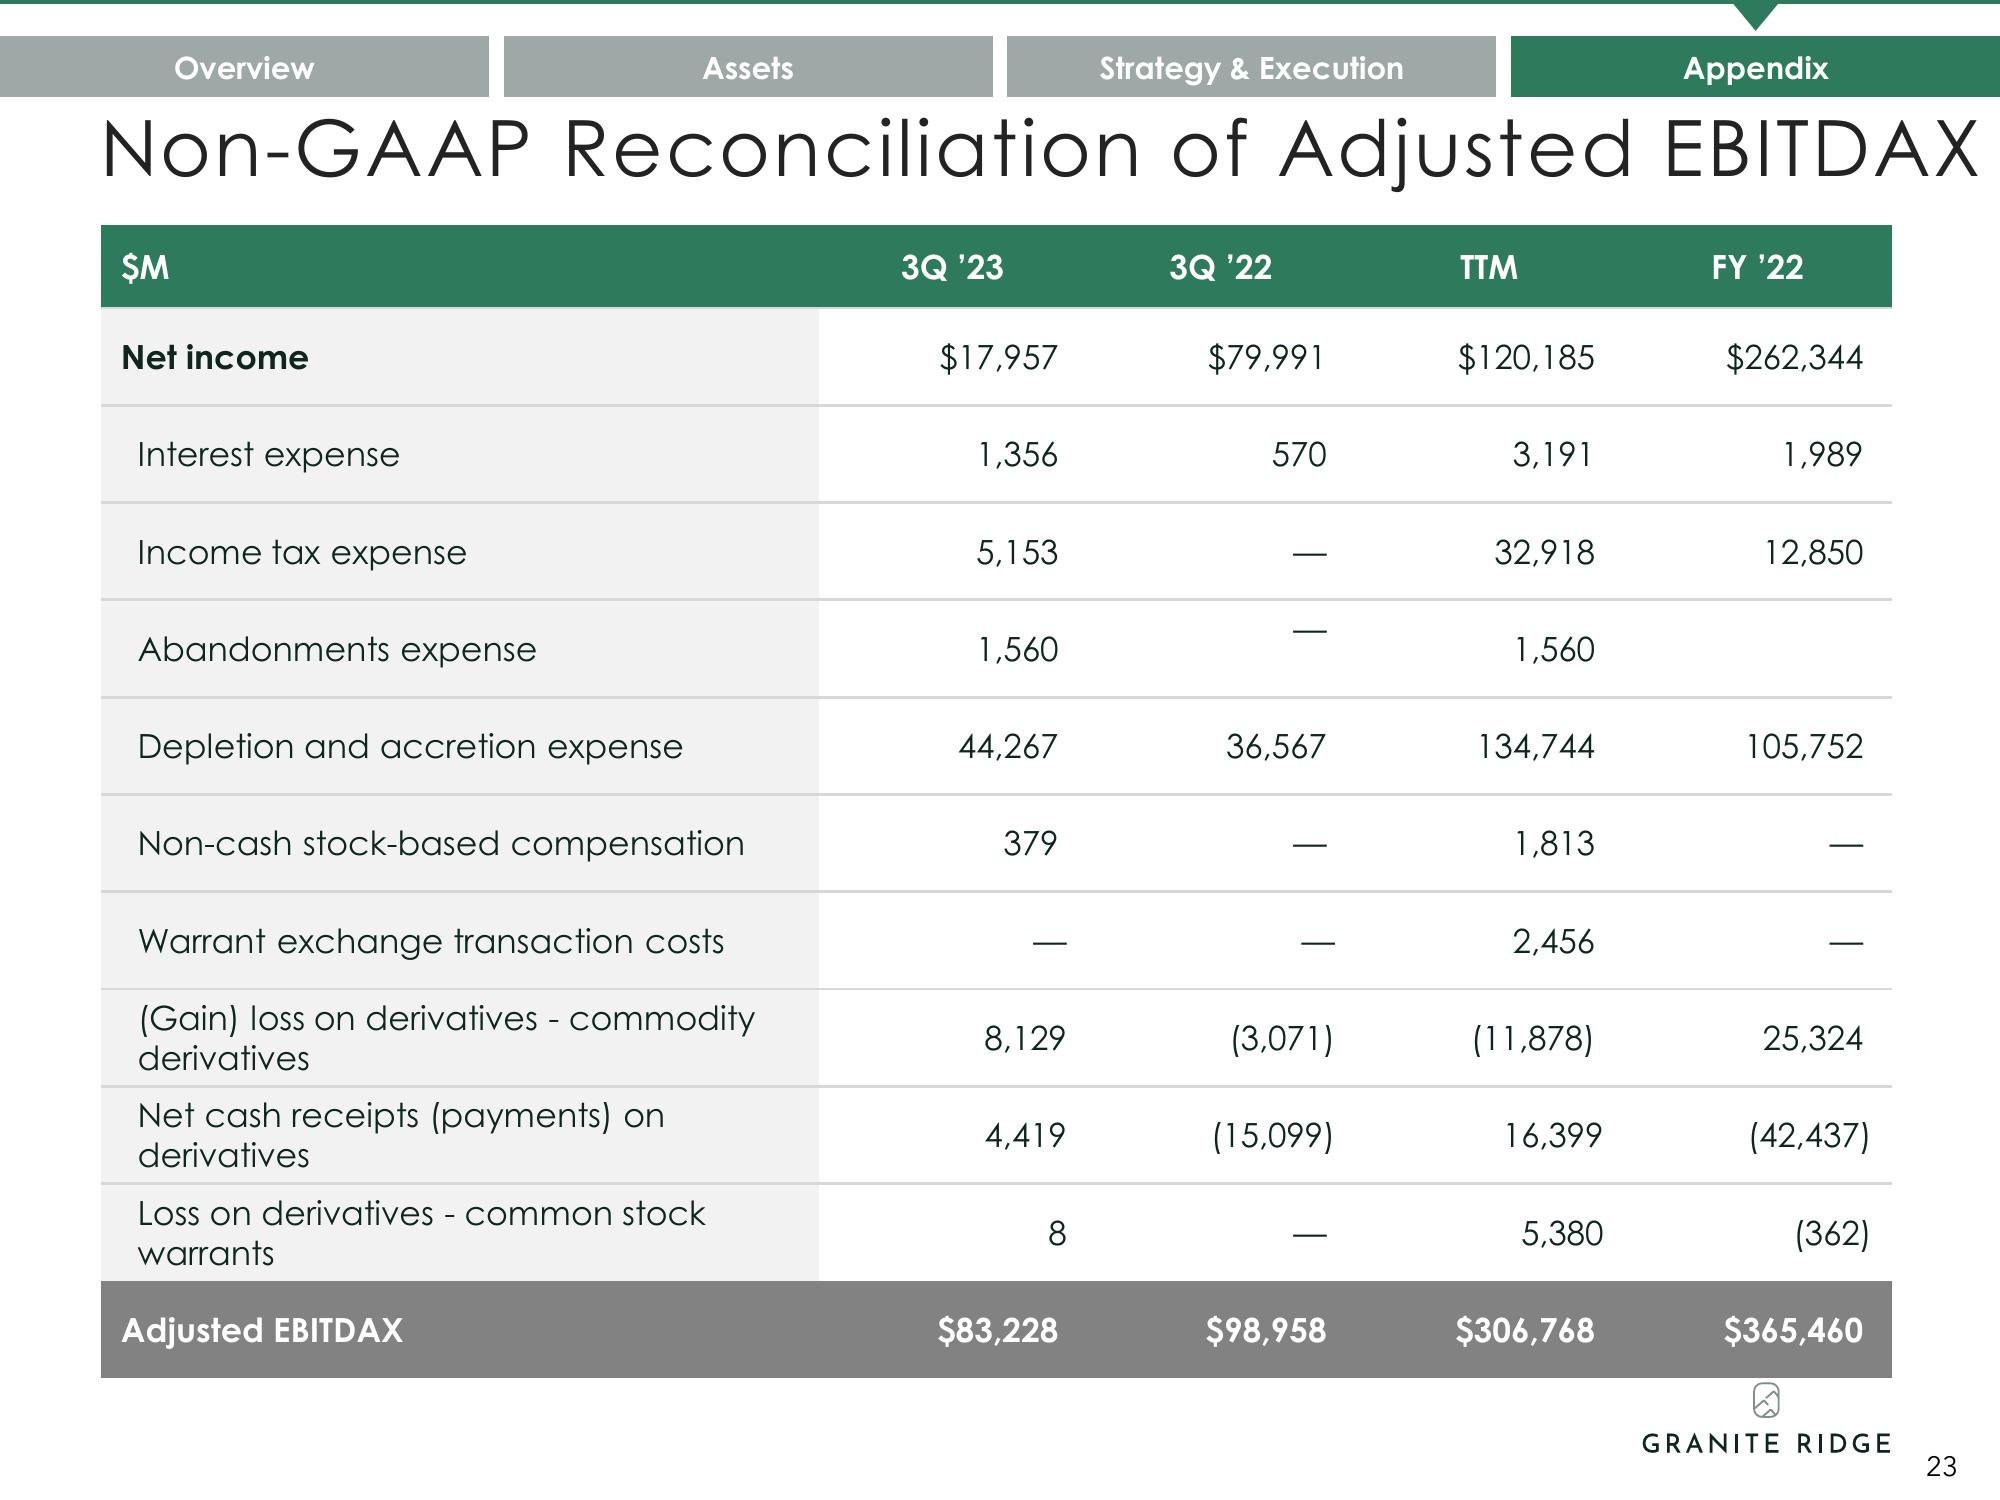
Overview $M Strategy & Execution Appendix Non-GAAP Reconciliation of Adjusted EBITDAX Net income Interest expense Income tax expense Abandonments expense Depletion and accretion expense Assets Non-cash stock-based compensation Warrant exchange transaction costs (Gain) loss on derivatives - commodity derivatives Net cash receipts (payments) on derivatives Loss on derivatives - common stock warrants Adjusted EBITDAX 3Q '23 $17,957 1,356 5,153 1,560 44,267 379 8,129 4,419 8 $83,228 3Q '22 $79,991 570 36,567 (3,071) (15,099) $98,958 TTM $120,185 3,191 32,918 1,560 134,744 1,813 2,456 (11,878) 16,399 5,380 $306,768 FY '22 $262,344 1,989 12,850 105,752 25,324 (42,437) (362) $365,460 GRANITE RIDGE 23
View entire presentation