Antofagasta Results Presentation Deck
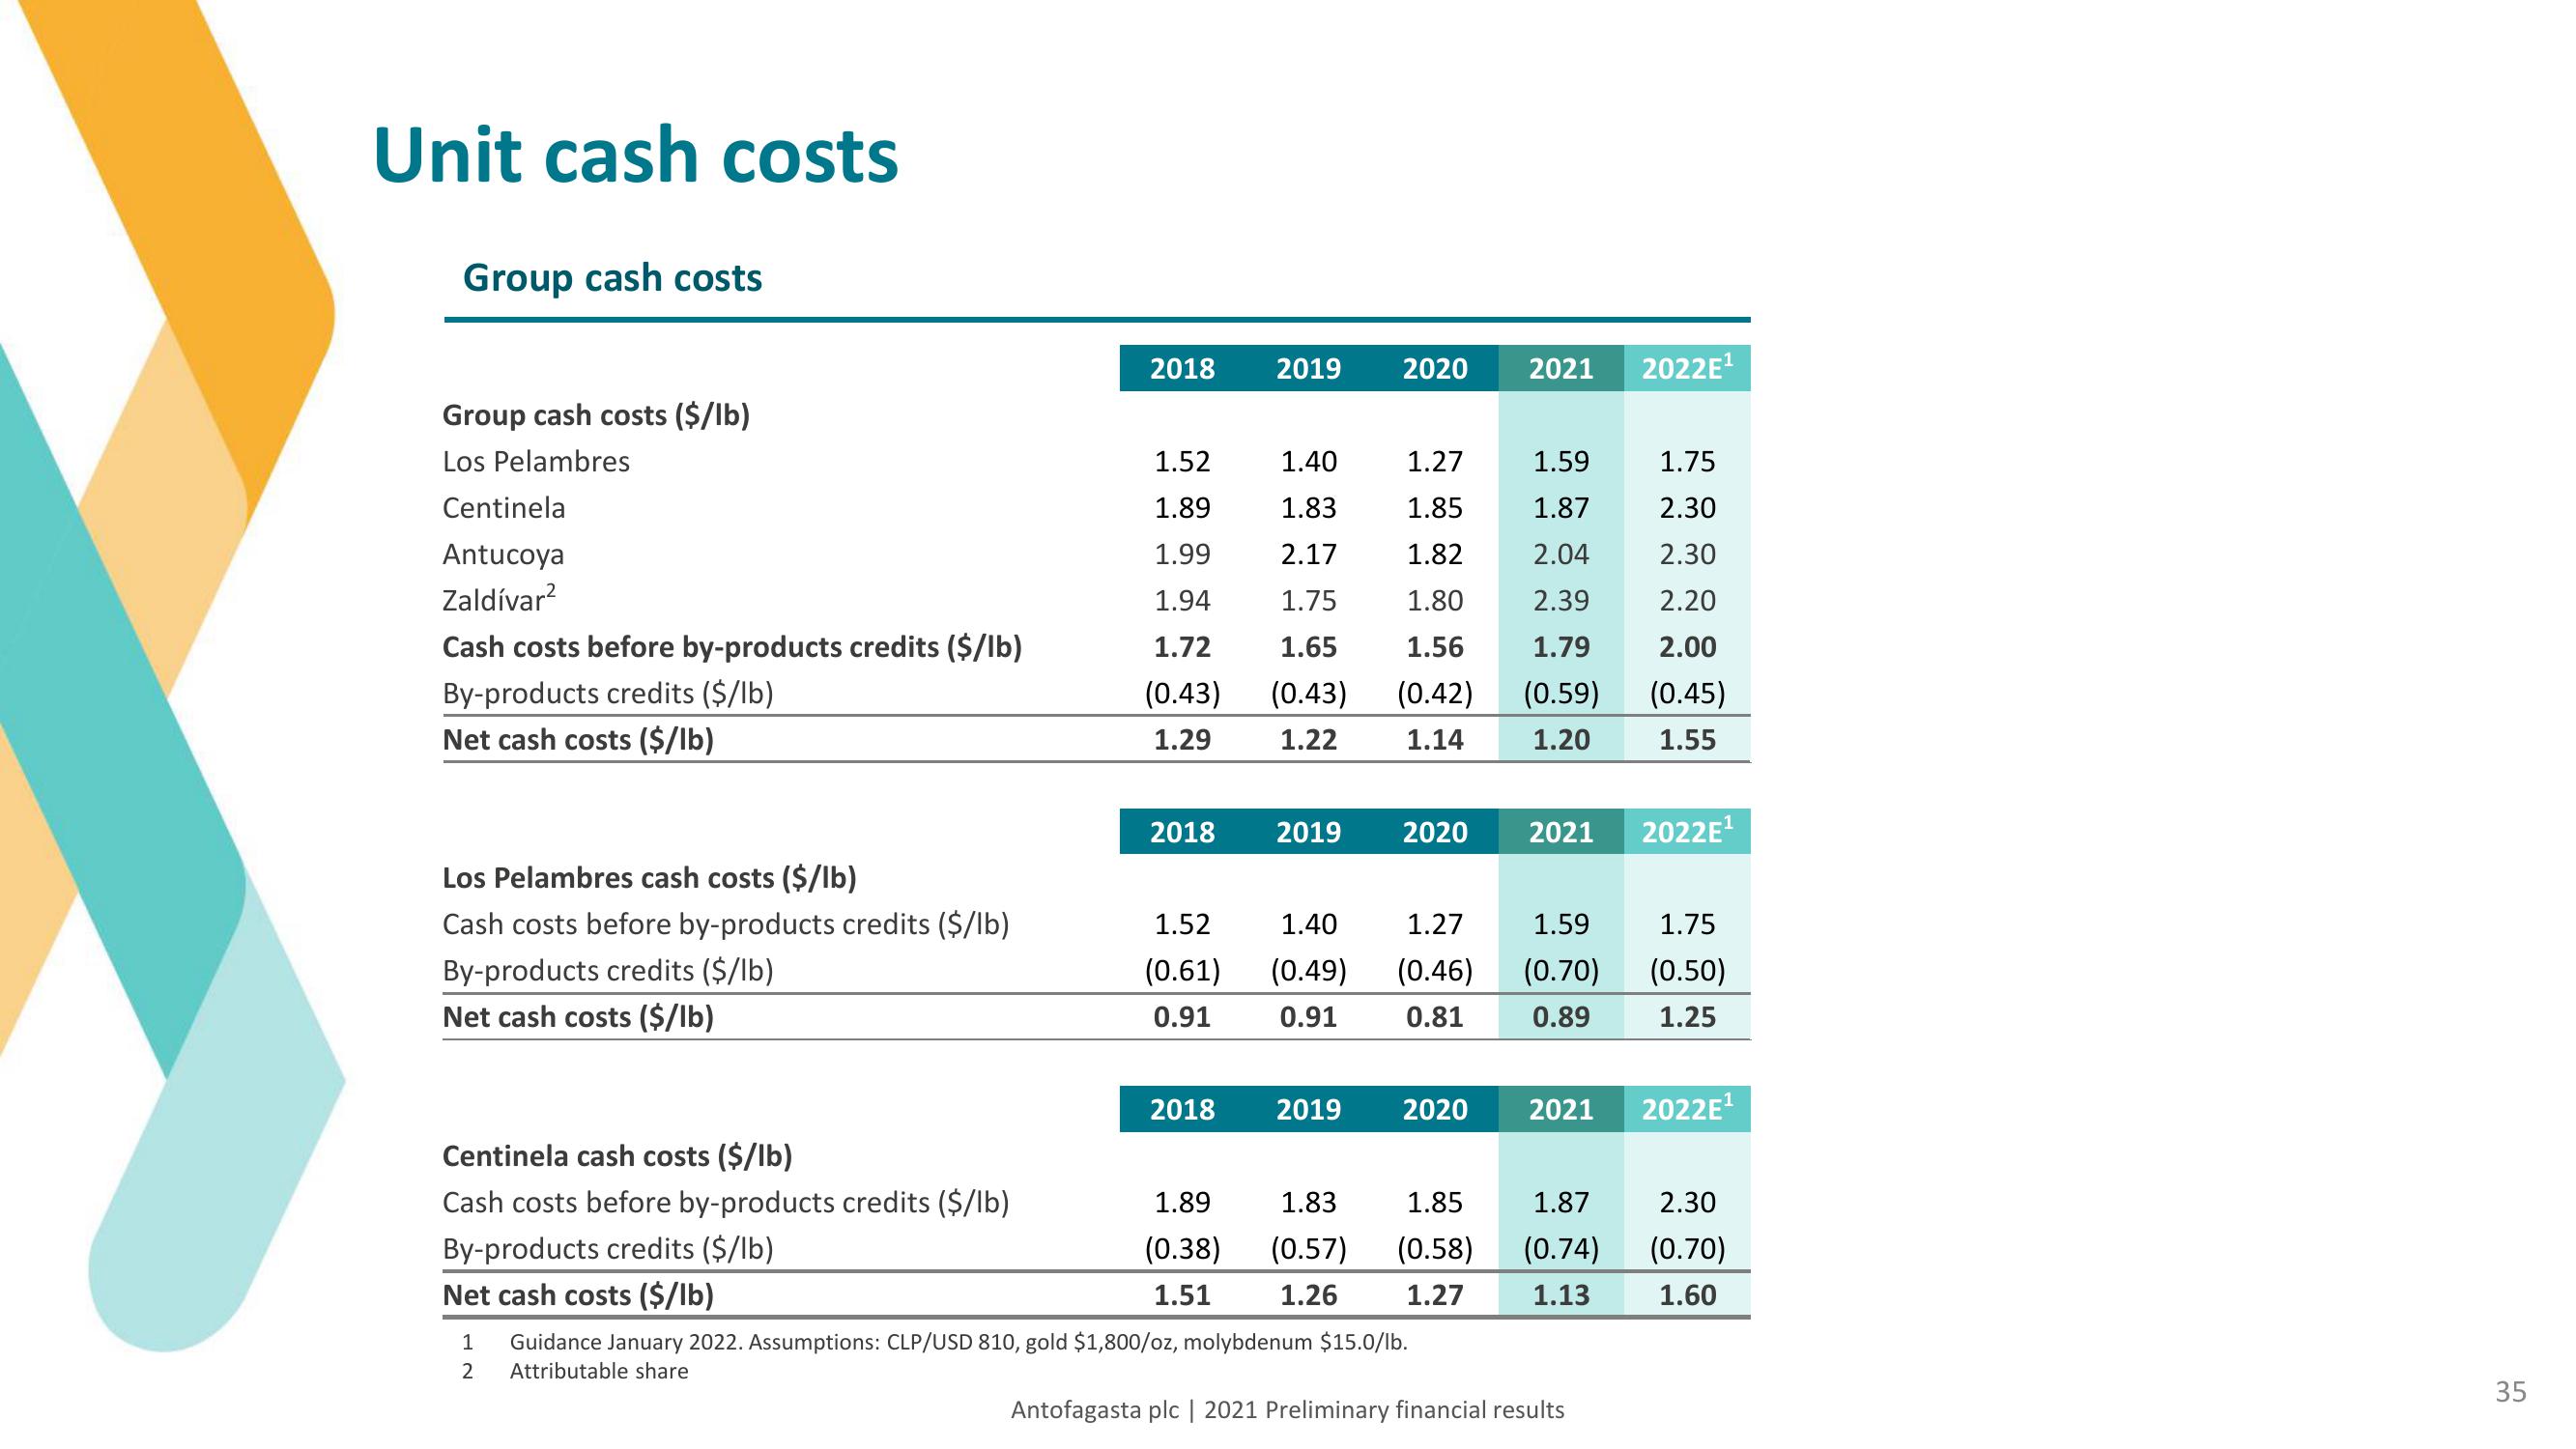
Unit cash costs
Group cash costs
Group cash costs ($/lb)
Los Pelambres
Centinela
Antucoya
Zaldívar²
Cash costs before by-products credits ($/lb)
By-products credits ($/lb)
Net cash costs ($/lb)
Los Pelambres cash costs ($/lb)
Cash costs before by-products credits ($/lb)
By-products credits ($/lb)
Net cash costs ($/lb)
Centinela cash costs ($/lb)
Cash costs before by-products credits ($/lb)
By-products credits ($/lb)
Net cash costs ($/lb)
2018
1.52
1.89
1.99
1.94
1.72
(0.43)
1.29
2018
1.52
(0.61)
0.91
2018
1.89
(0.38)
1.51
2019 2020
1.40
1.27
1.59
1.83
1.85
1.87
2.17
1.82
2.04
1.75
1.80
2.39
1.65
1.56
1.79
(0.43) (0.42) (0.59)
1.22
1.14
1.20
2019 2020
1.40
(0.49)
0.91
2019 2020
1.83
(0.57)
1.26
2021
1.27 1.59
(0.46) (0.70)
0.81 0.89
2021
1 Guidance January 2022. Assumptions: CLP/USD 810, gold $1,800/oz, molybdenum $15.0/lb.
2 Attributable share
2022E¹
1.75
2.30
2.30
2.20
2.00
(0.45)
1.55
Antofagasta plc | 2021 Preliminary financial results
2022E¹
1.75
(0.50)
1.25
2021 2022E¹
2.30
1.85
1.87
(0.58) (0.74) (0.70)
1.27
1.13
1.60
35View entire presentation