Nuvei Results Presentation Deck
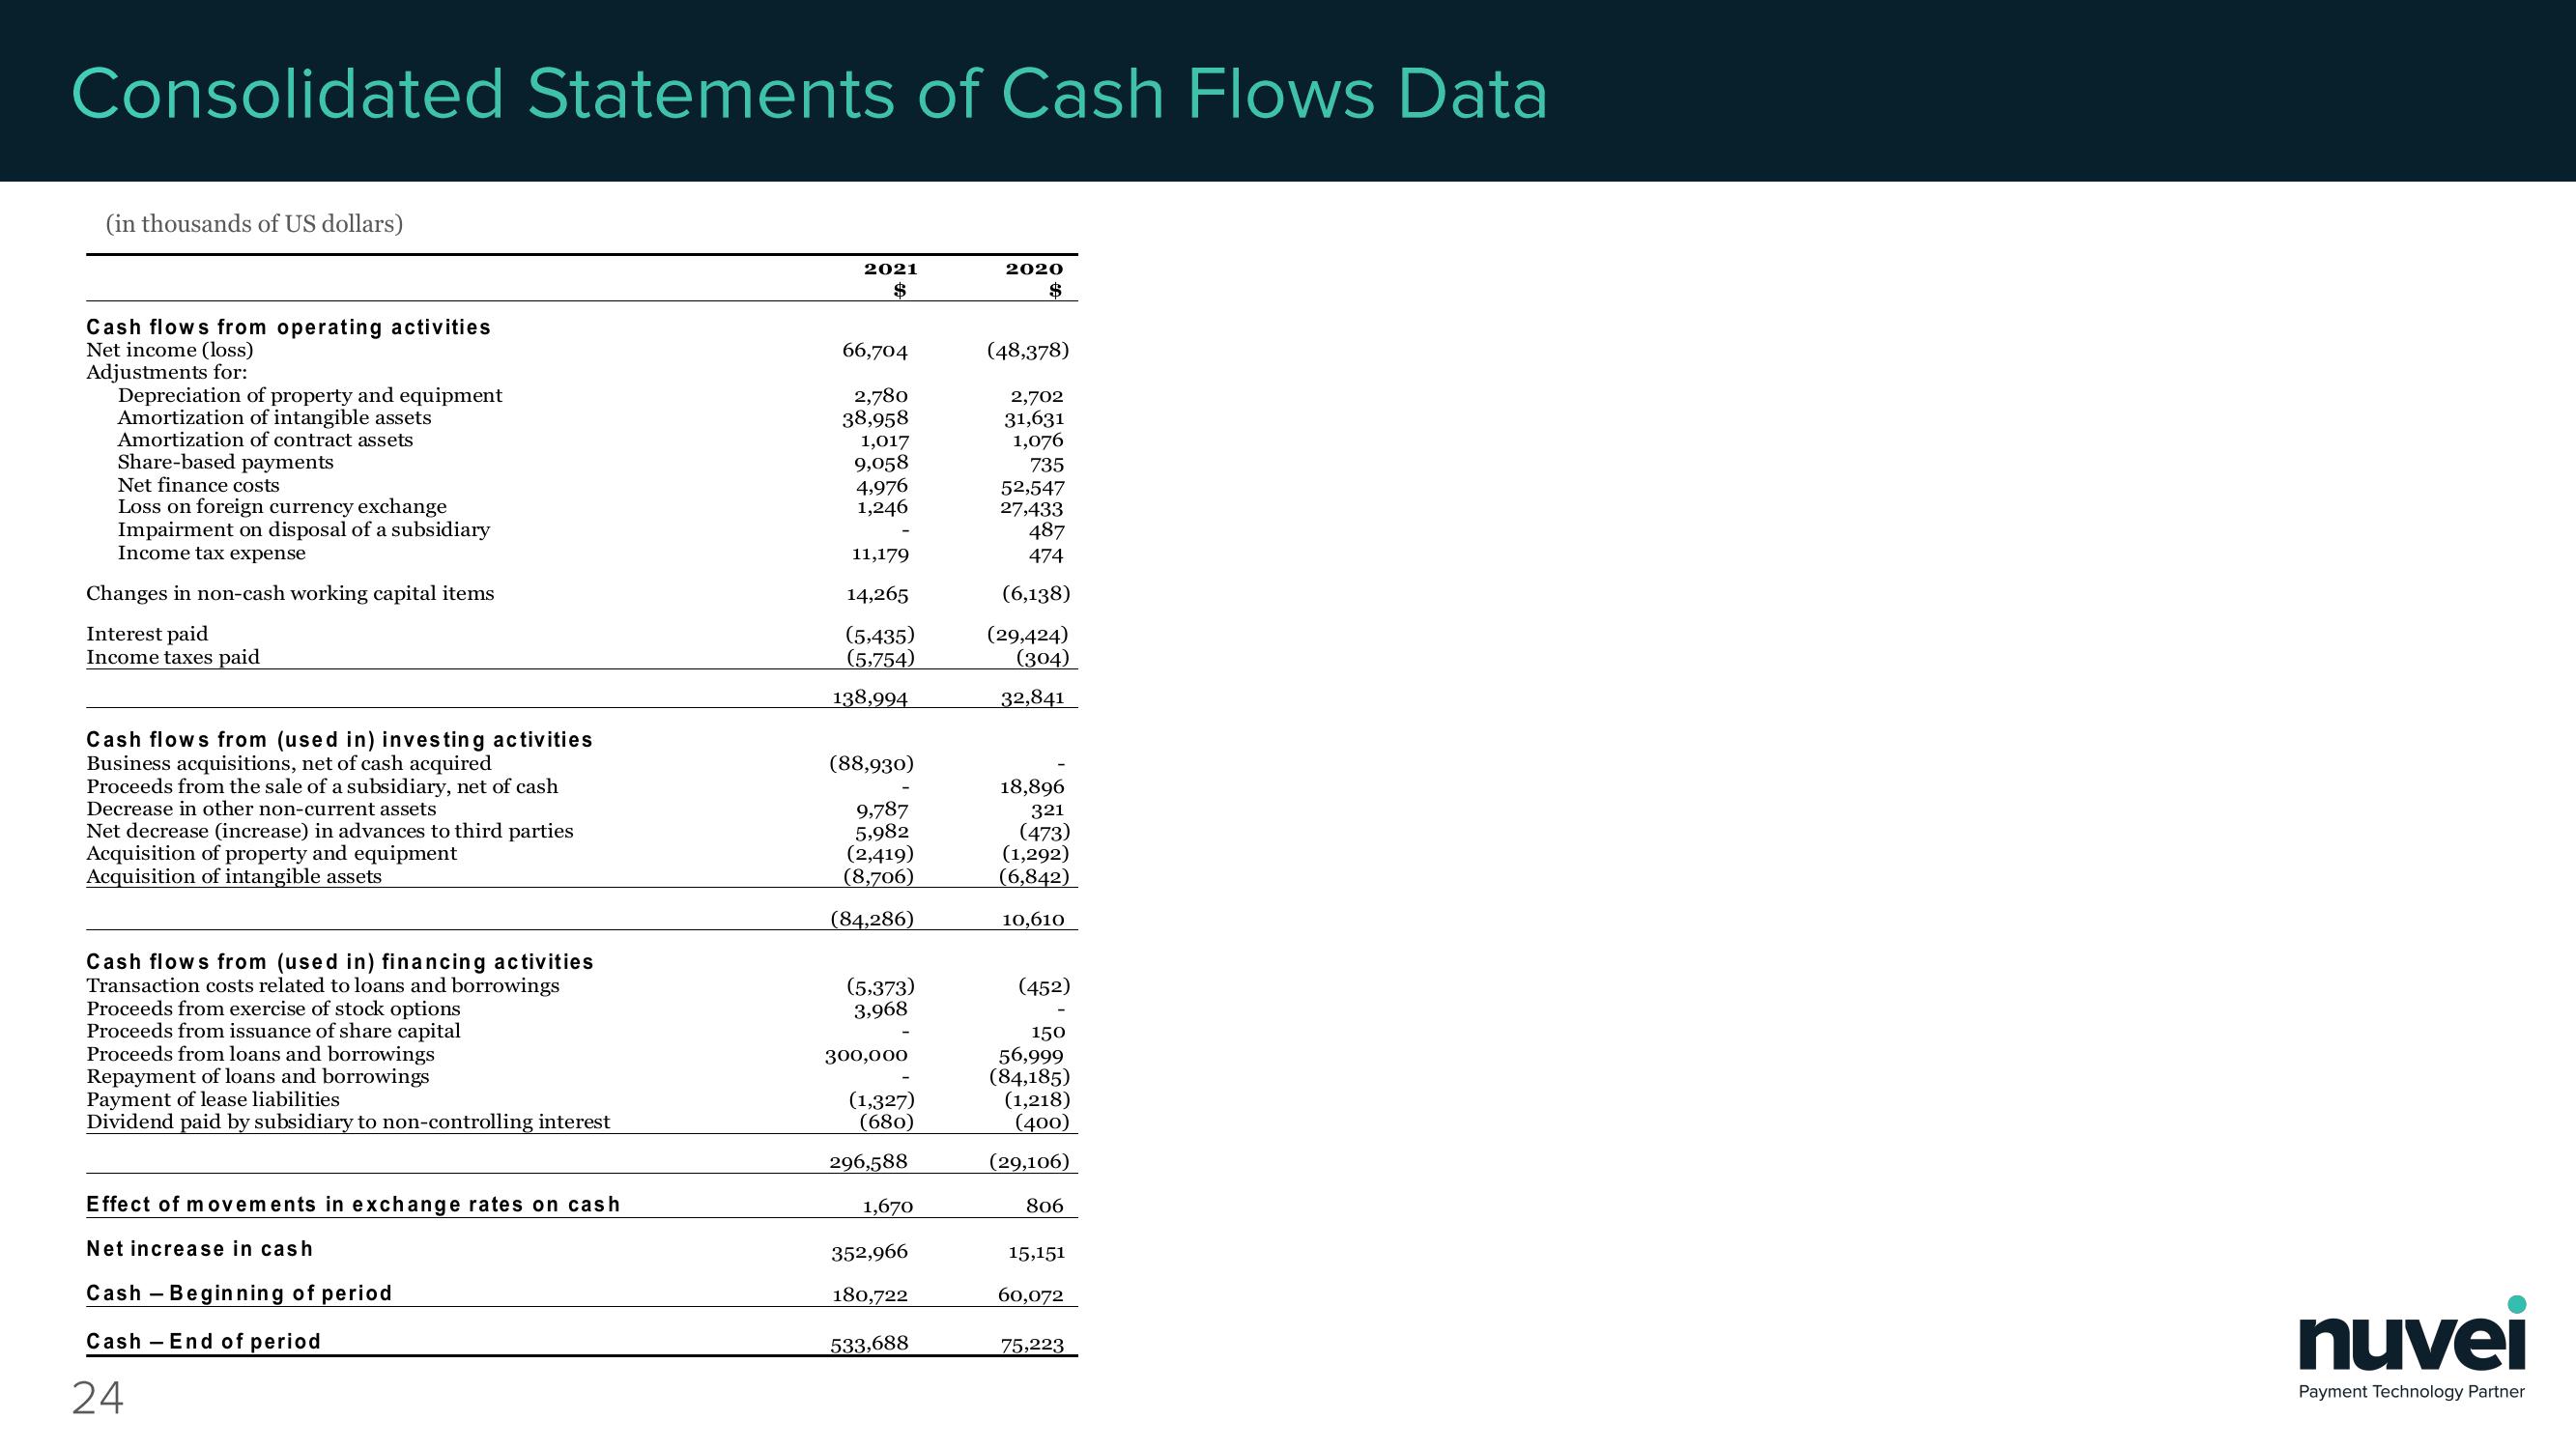
Consolidated Statements of Cash Flows Data
(in thousands of US dollars)
Cash flows from operating activities
Net income (loss)
Adjustments for:
Depreciation of property and equipment
Amortization of intangible assets
Amortization of contract assets
Share-based payments
Net finance costs
Loss on foreign currency exchange
Impairment on disposal of a subsidiary
Income tax expense
Changes in non-cash working capital items
Interest paid
Income taxes paid
Cash flows from (used in) investing activities
Business acquisitions, net of cash acquired
Proceeds from the sale of a subsidiary, net of cash
Decrease in other non-current assets
Net decrease (increase) in advances to third parties
Acquisition of property and equipment
Acquisition of intangible assets
Cash flows from (used in) financing activities
Transaction costs related to loans and borrowings
Proceeds from exercise of stock options
Proceeds from issuance of share capital
Proceeds from loans and borrowings
Repayment of loans and borrowings
Payment of lease liabilities
Dividend paid by subsidiary to non-controlling interest
Effect of movements in exchange rates on cash
Net increase in cash
Cash Beginning of period
Cash End of period
24
2021
$
66,704
2,780
38,958
1,017
9,058
4,976
1,246
11,179
14,265
(5,435)
(5,754)
138,994
(88,930)
9,787
5,982
(2,419)
(8,706)
(84,286)
(5,373)
3,968
300,000
(1,327)
(680)
296,588
1,670
352,966
180,722
533,688
2020
$
(48,378)
2,702
31,631
1,076
735
52,547
27,433
487
474
(6,138)
(29,424)
(304)
32,841
18,896
321
(473)
(1,292)
(6,842)
10,610
(452)
150
56,999
(84,185)
(1,218)
(400)
(29,106)
806
15,151
60,072
75,223
nuvei
Payment Technology PartnerView entire presentation