Allbirds Investor Presentation Deck
INVESTOR OVERVIEW
Physical retail is strong on
a standalone basis...
●
●
●
●
Highly profitable with strong financial performance before
considering overall region lift
Capital efficient with attractive payback periods
Data-driven approach to market prioritization and site
selection
Positioned well to take advantage of physical retail's
recovery from the pandemic
allbirds
allbirds
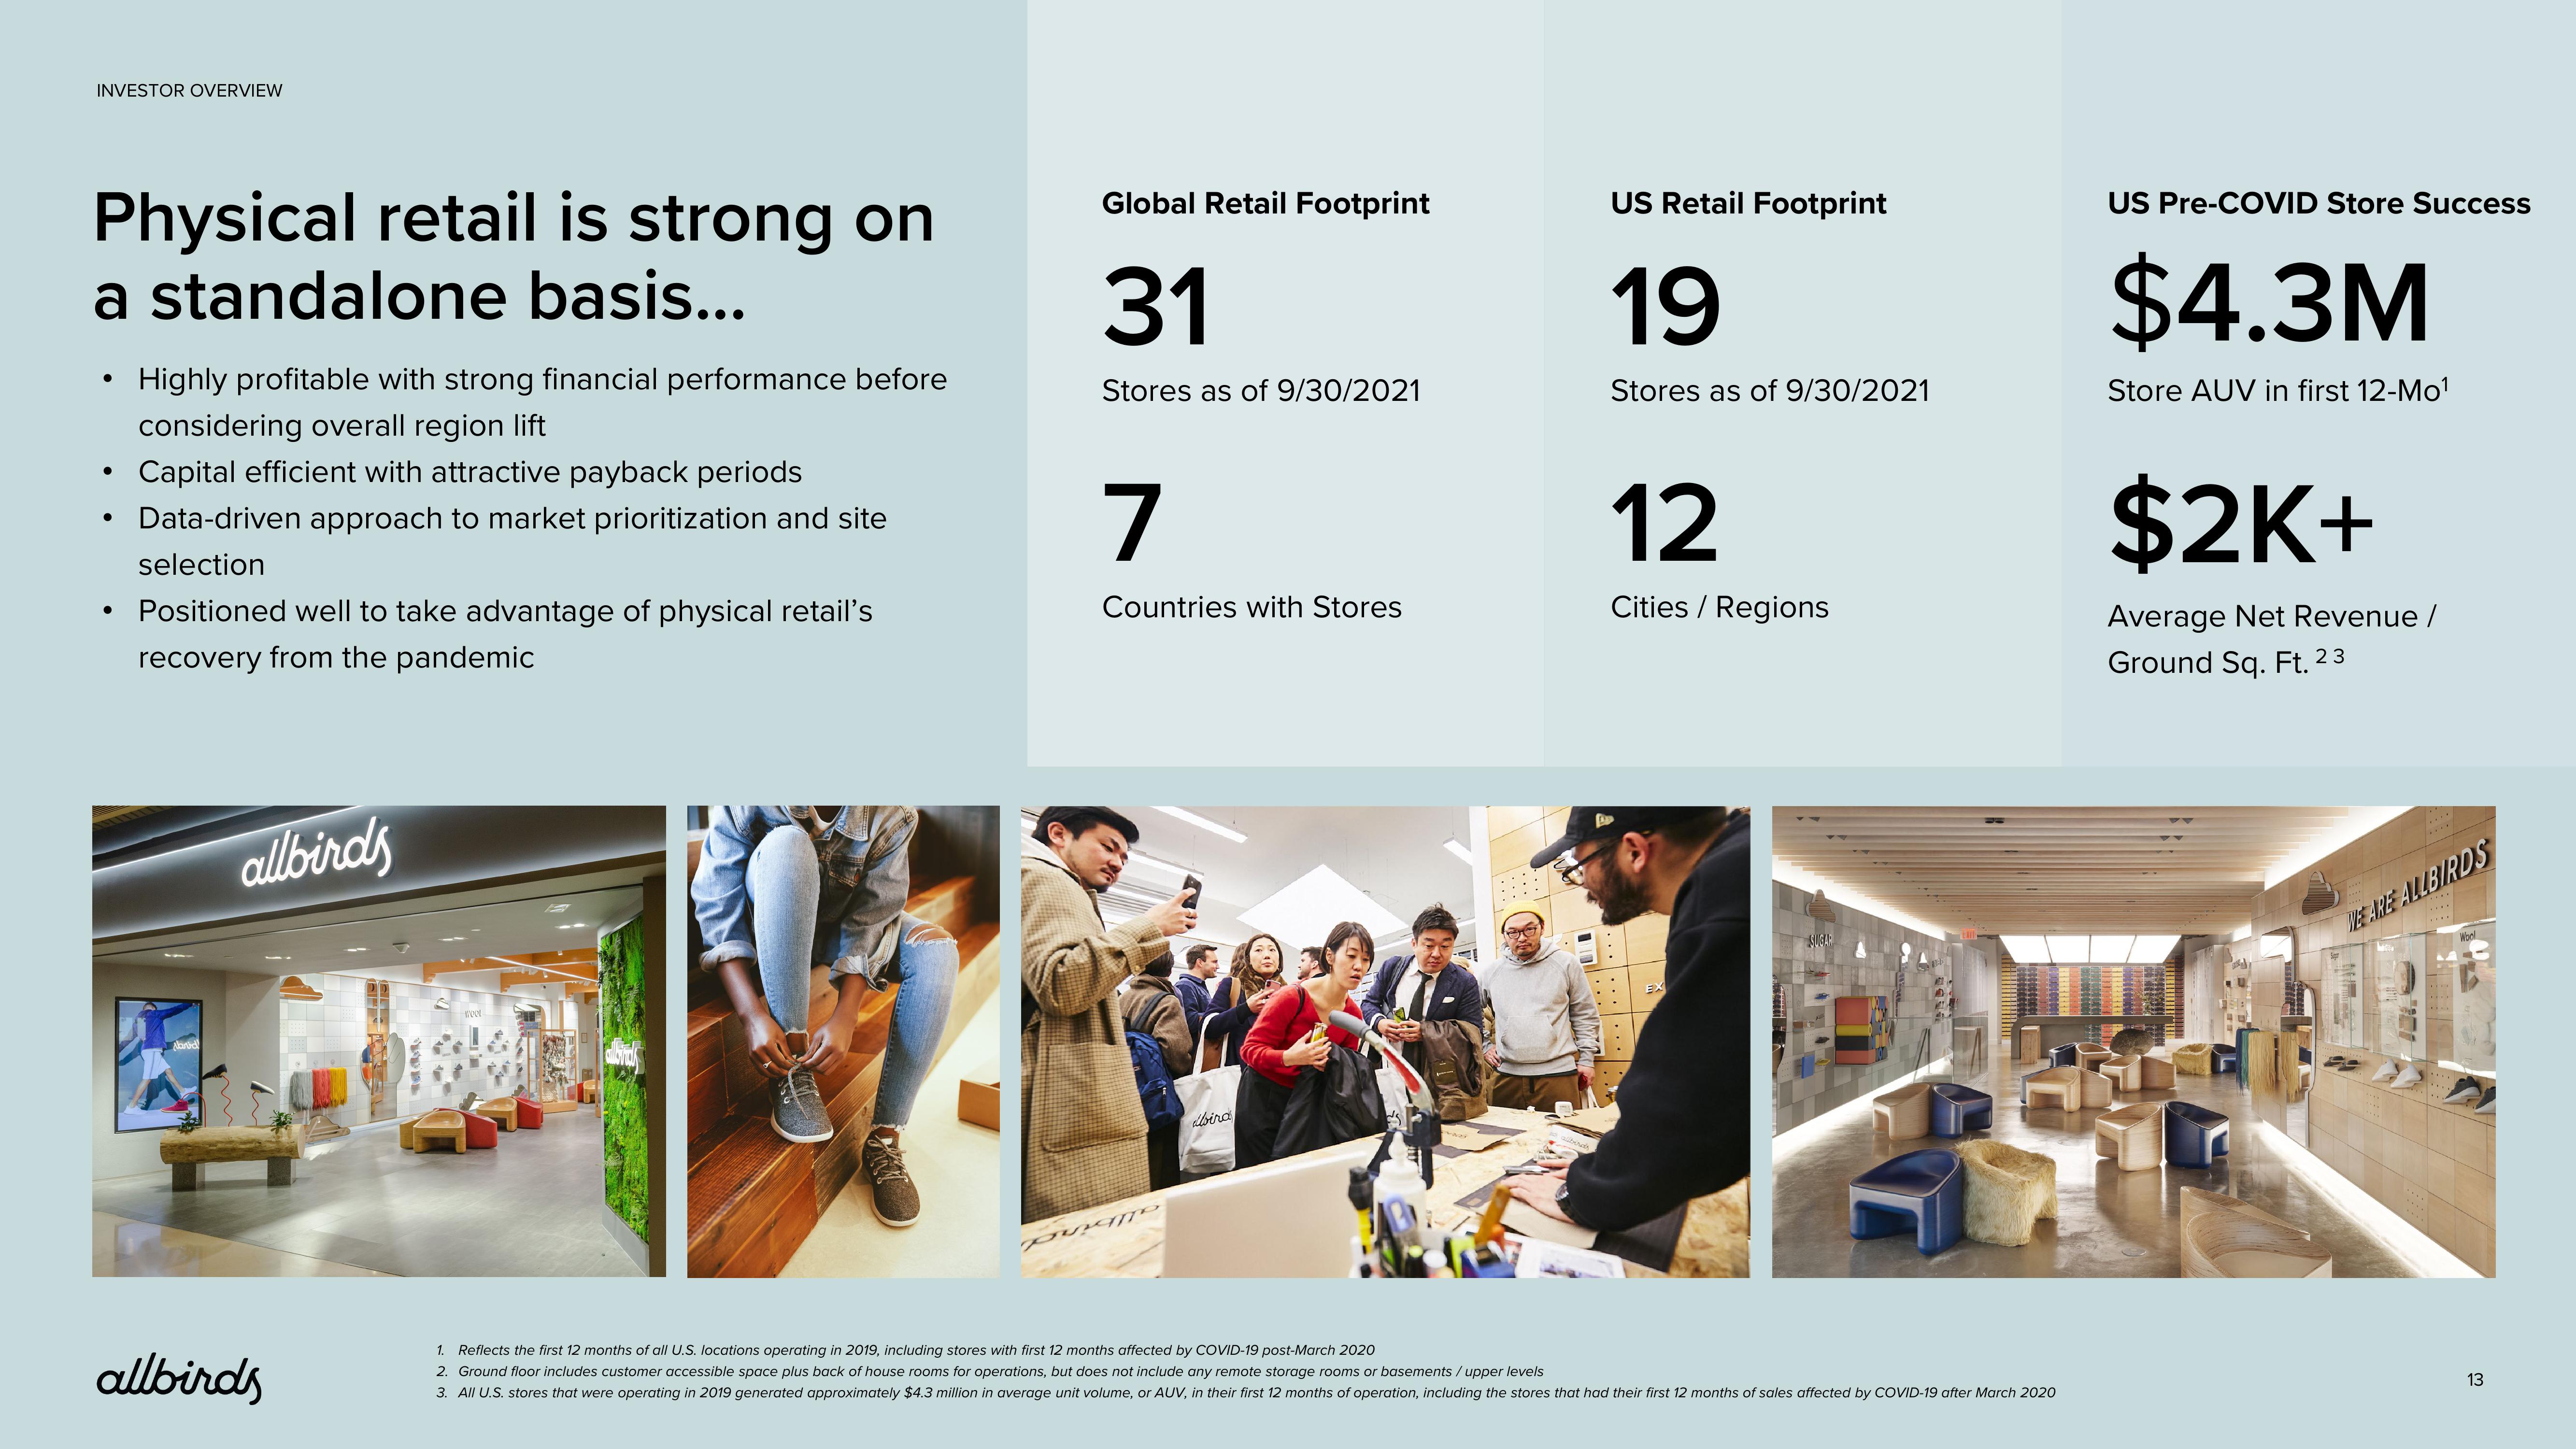
Global Retail Footprint
31
Stores as of 9/30/2021
7
Countries with Stores
O
Alira
US Retail Footprint
19
Stores as of 9/30/2021
12
Cities / Regions
1. Reflects the first 12 months of all U.S. locations operating in 2019, including stores with first 12 months affected by COVID-19 post-March 2020
2. Ground floor includes customer accessible space plus back of house rooms for operations, but does not include any remote storage rooms or basements/upper levels
3. All U.S. stores that were operating in 2019 generated approximately $4.3 million in average unit volume, or AUV, in their first 12 months of operation, including the stores that had their first 12 months of sales affected by COVID-19 after March 2020
US Pre-COVID Store Success
$4.3M
Store AUV in first 12-Mo¹
$2K+
Average Net Revenue /
Ground Sq. Ft. 23
WE ARE ALLBIRDS
13View entire presentation