Ashtead Group Results Presentation Deck
US CONSTRUCTION MARKET OUTLOOK
300
250
200
150
100
50
2009
2013
2005 2007
Source: Dodge Data & Analytics (November 2021)
190
170
150
130
110
90
70
50
Dodge construction starts
Indexed: 2000-100
2011
2015
2002
2004
2006 2008 2010
Source: Dodge Data & Analytics (November 2021)
16
Half year results ¦ 31 October 2021
سہ
2017
2012
Dodge momentum index
Indexed: 2000=100, seasonally adjusted
2019
2021
2014
2023
numphant
2016
2025
2018
2020
Construction put in place ($bn)
Non-residential
Non-building
Construction (excl. resi)
Residential
Construction (total)
Construction growth
Rental market ($bn)
Rental¹
2019
■
2020
2021 2022
■
2023 2024 2025
51
52
46
48
-9% +3% +10%
Rental growth
+6%
Source: Dodge Data & Analytics (September 2021) / IHS Markit (November 2021)
1 Excluding party and event
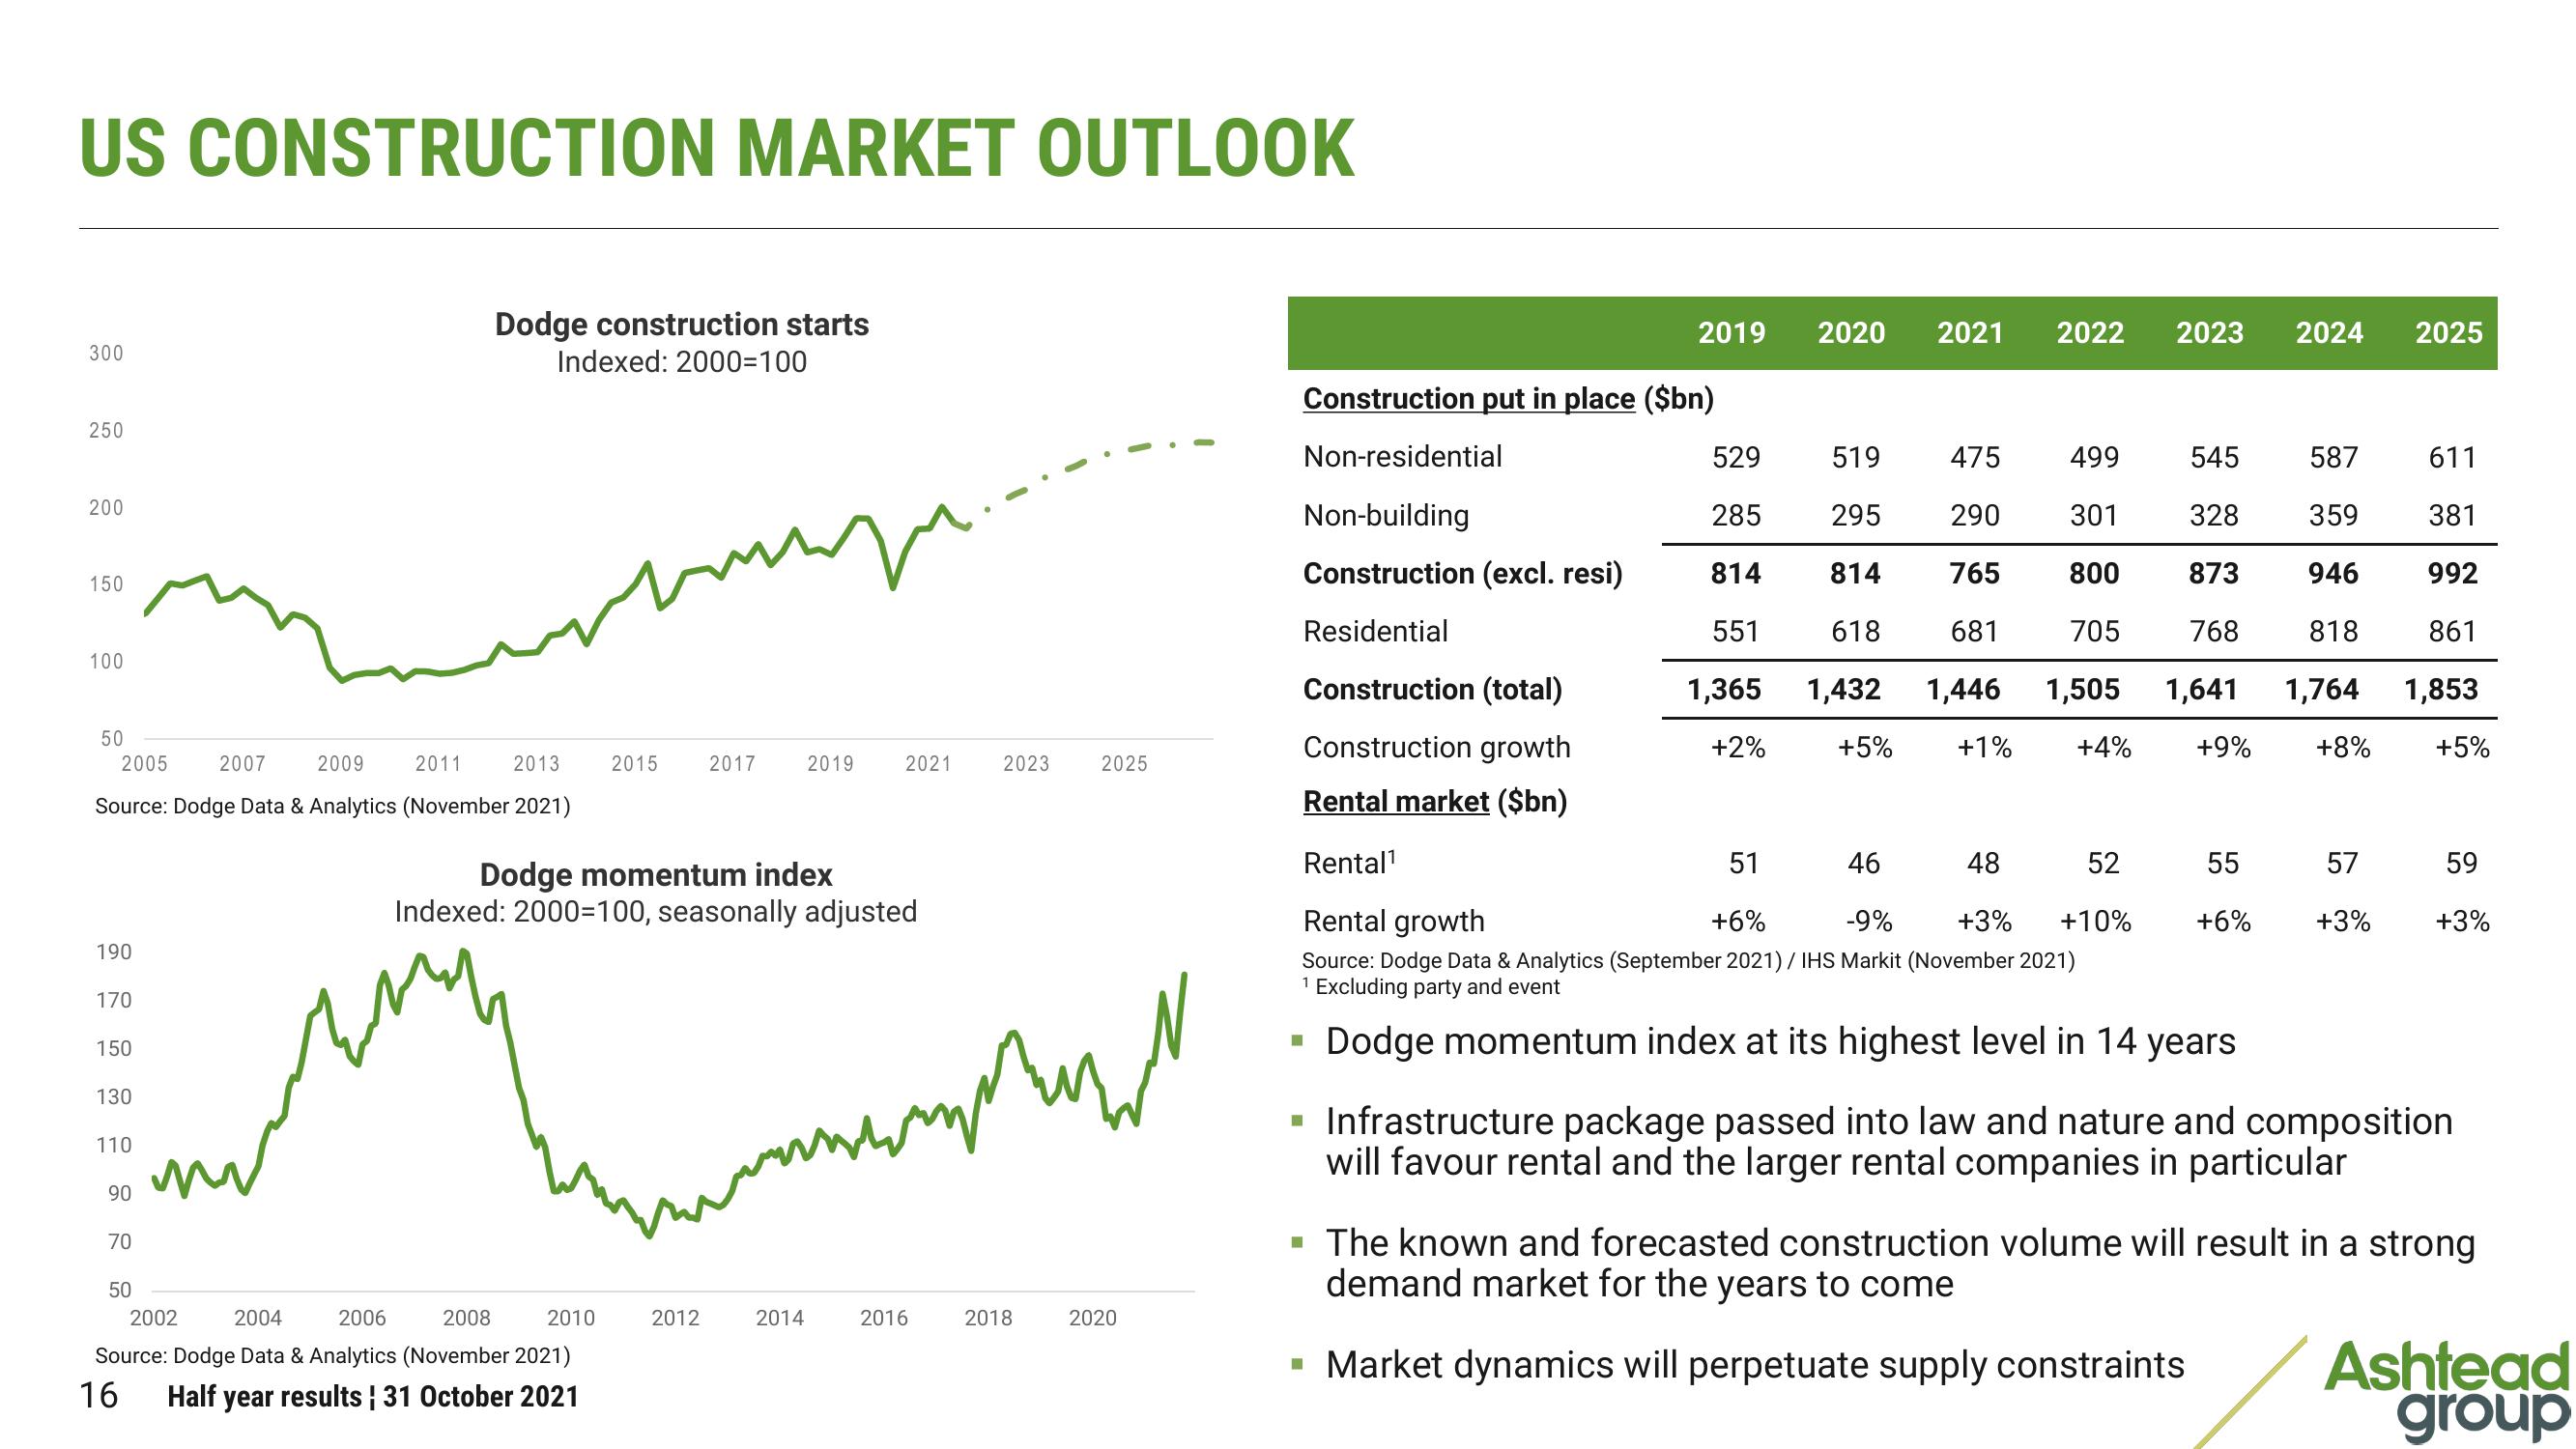
Dodge momentum index at its highest level in 14 years
529
519
475
499
545
285
295
290
301
328
814
814
765
800
873
618 681
705
768
551
1,365 1,432 1,446 1,505 1,641
+2% +5% +1%
+4%
+9%
55
+6%
587
611
359
381
946
992
818
861
1,764 1,853
+8%
+5%
57
+3%
59
+3%
▪ Infrastructure package passed into law and nature and composition
will favour rental and the larger rental companies in particular
The known and forecasted construction volume will result in a strong
demand market for the years to come
▪ Market dynamics will perpetuate supply constraints
Ashtead
groupView entire presentation