Q1 2023 Earnings Presentation slide image

Q1 2023 Earnings Presentation

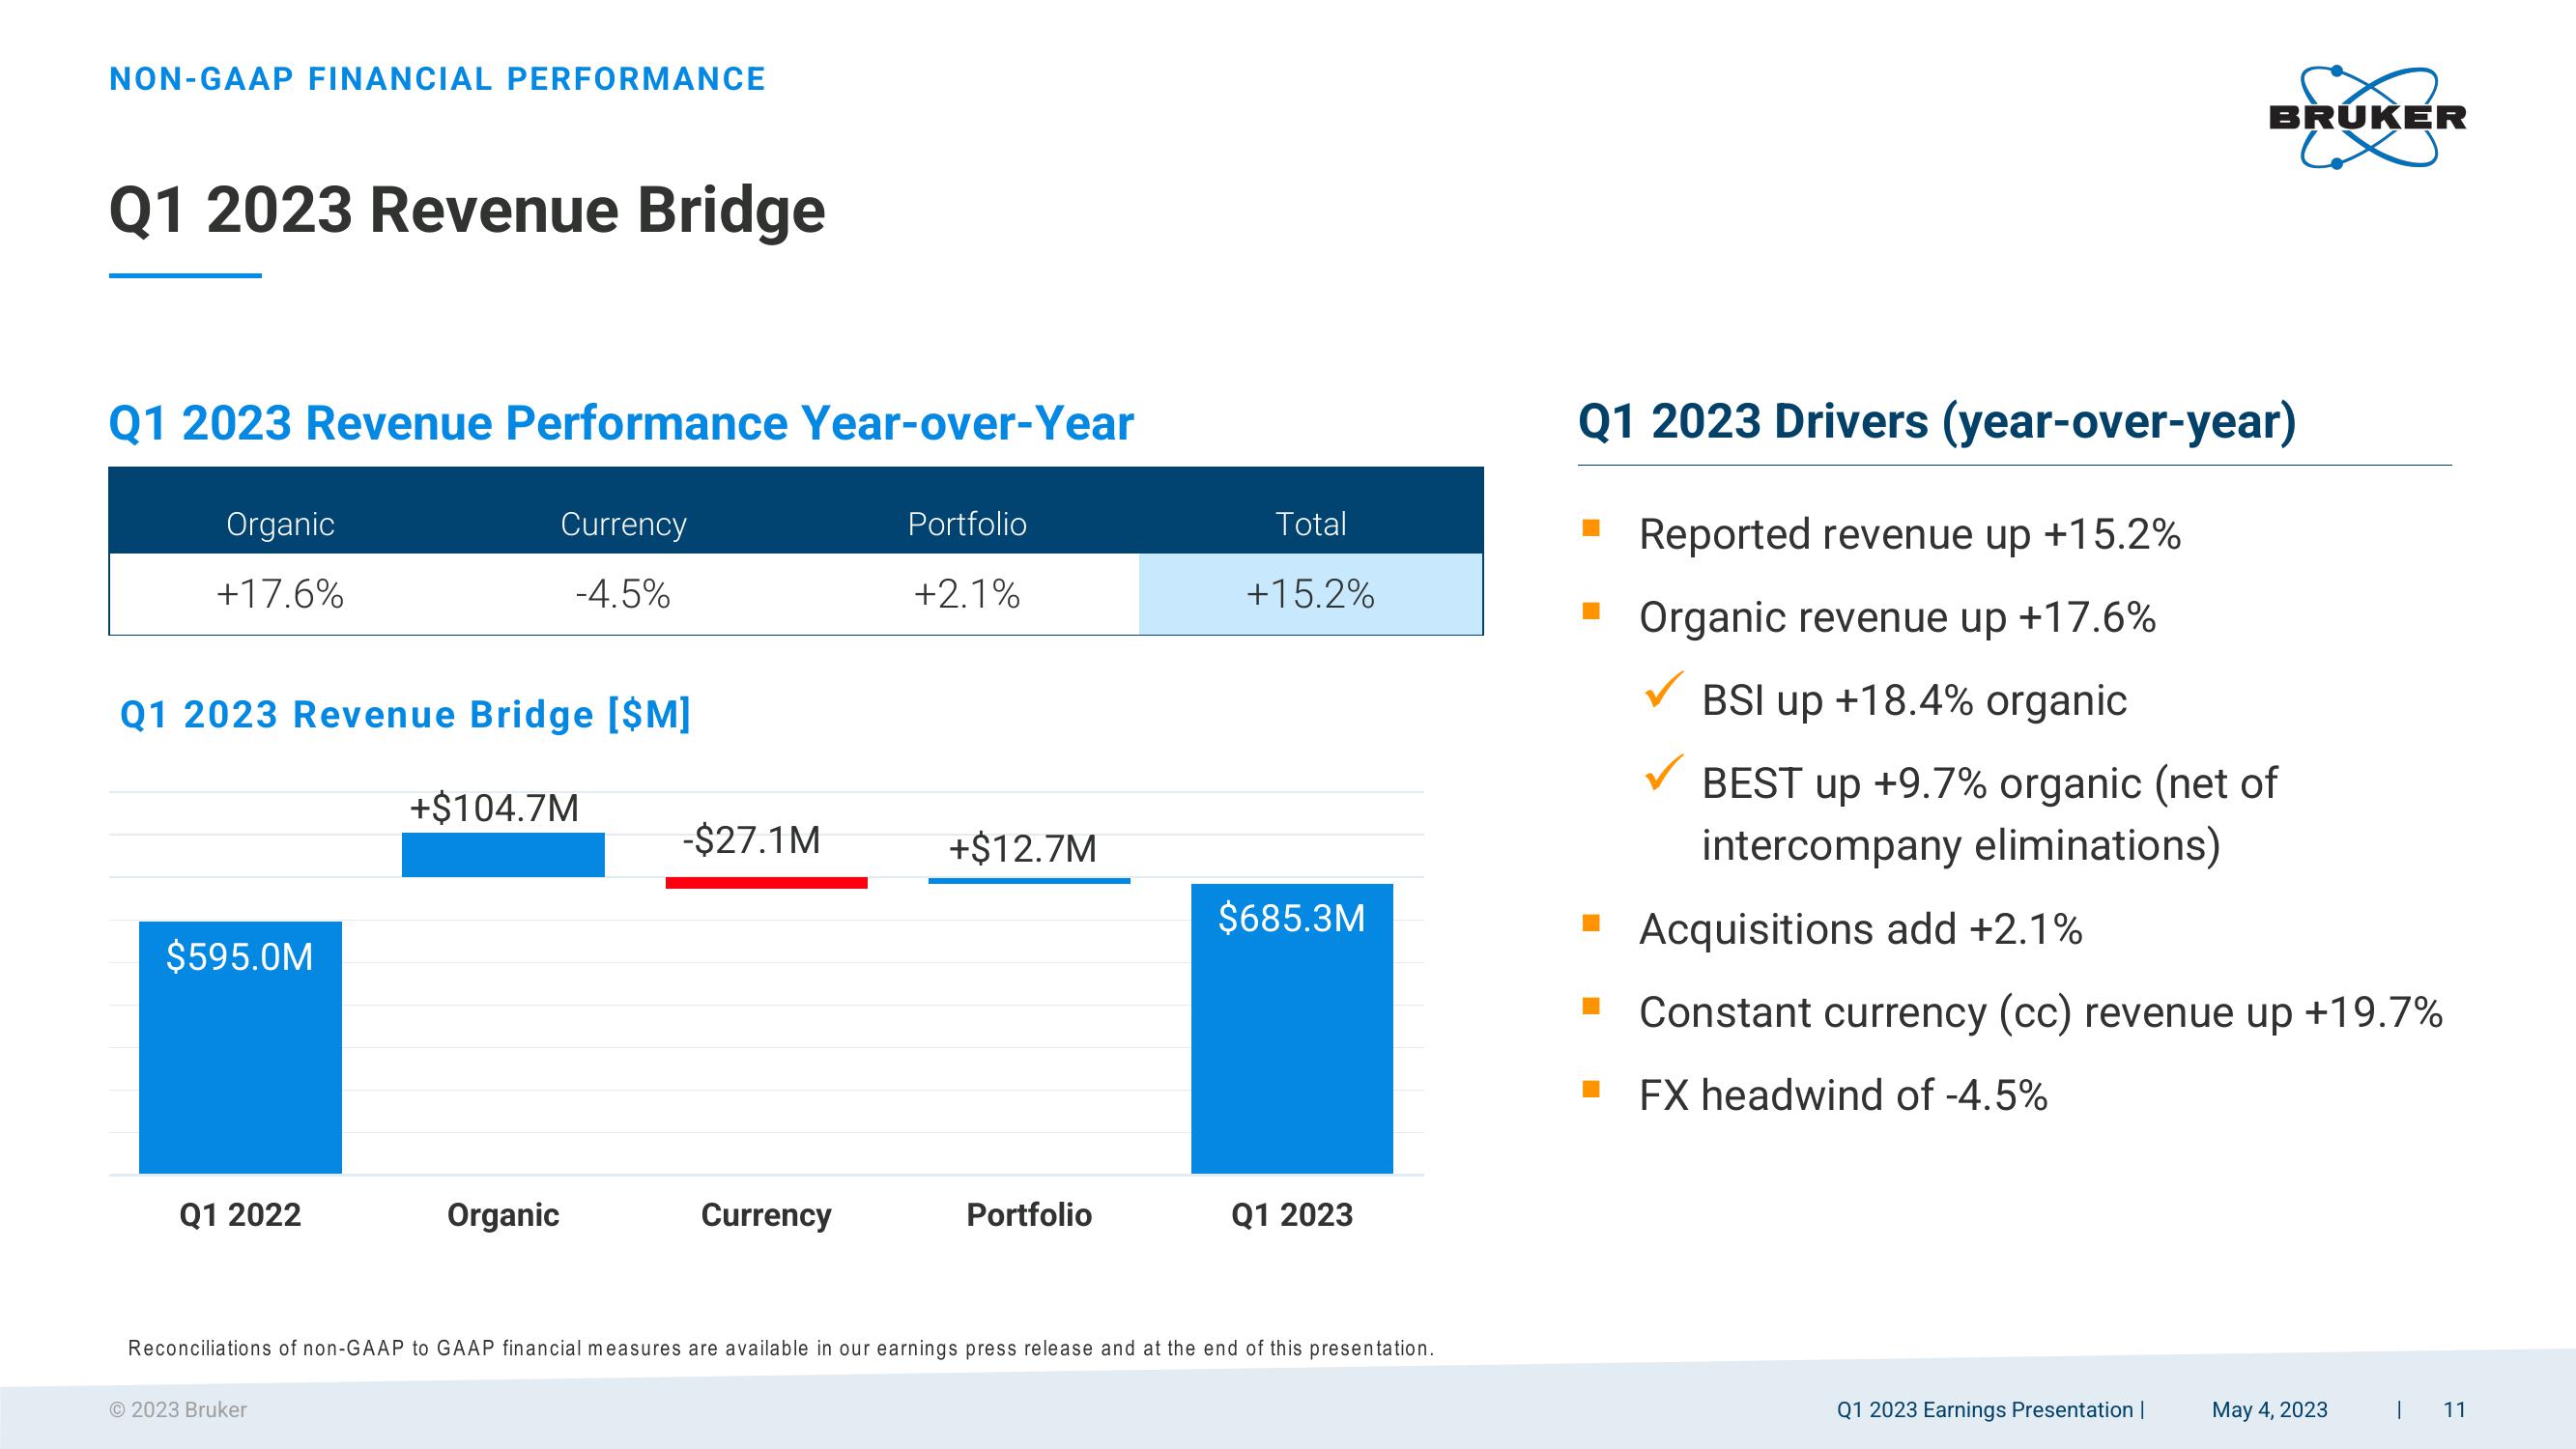
NON-GAAP FINANCIAL PERFORMANCE Q1 2023 Revenue Bridge Q1 2023 Revenue Performance Year-over-Year Organic +17.6% Q1 2023 Revenue Bridge [$M] $595.0M Q1 2022 Currency -4.5% 2023 Bruker +$104.7M Organic -$27.1M Currency Portfolio +2.1% +$12.7M Portfolio Total +15.2% $685.3M Q1 2023 Reconciliations of non-GAAP to GAAP financial measures are available in our earnings press release and at the end of this presentation. BRUKER Q1 2023 Drivers (year-over-year) ▪ Reported revenue up +15.2% Organic revenue up +17.6% BSI up +18.4% organic BEST up +9.7% organic (net of intercompany eliminations) ■ Acquisitions add +2.1% Constant currency (cc) revenue up +19.7% ■ FX headwind of -4.5% Q1 2023 Earnings Presentation | May 4, 2023 11
View entire presentation