Liberty Global Results Presentation Deck
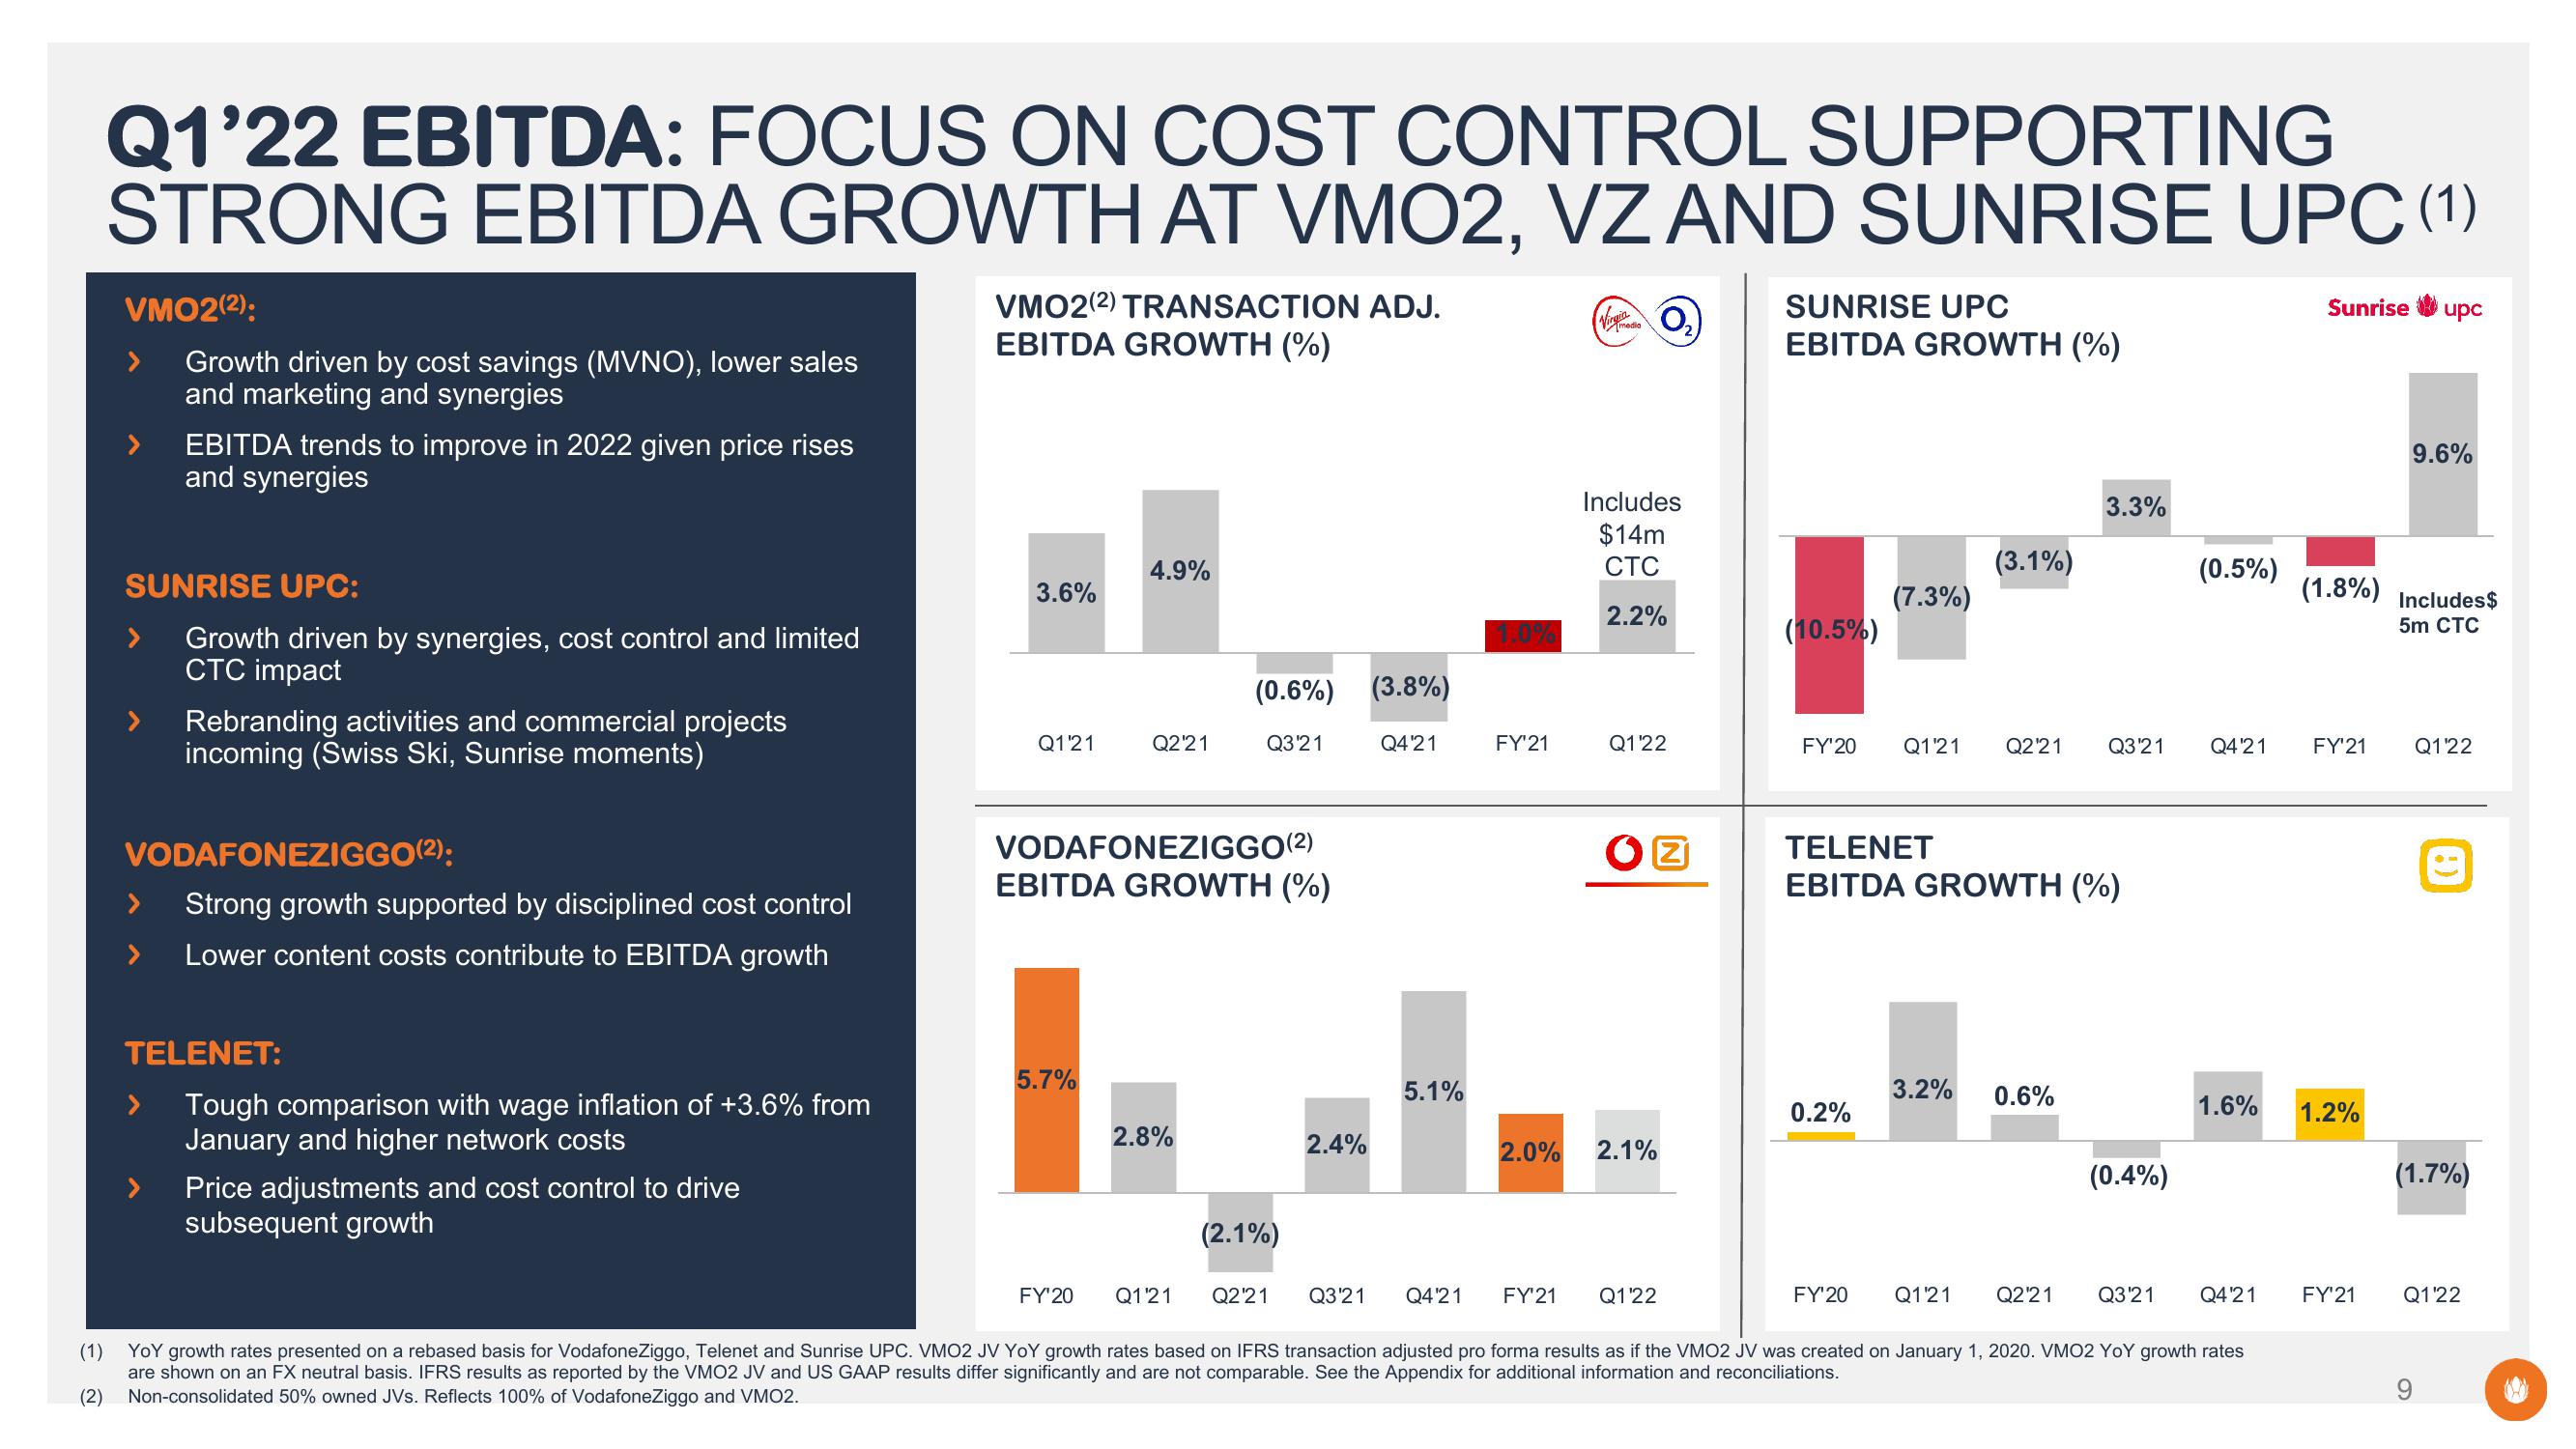
Q1'22 EBITDA: FOCUS ON COST CONTROL SUPPORTING
STRONG EBITDA GROWTH AT VMO2, VZ AND SUNRISE UPC (1)
VMO2(2):
Growth driven by cost savings (MVNO), lower sales
and marketing and synergies
EBITDA trends to improve in 2022 given price rises
and synergies
SUNRISE UPC:
Growth driven by synergies, cost control and limited
CTC impact
Rebranding activities and commercial projects
incoming (Swiss Ski, Sunrise moments)
VODAFONEZIGGO(2):
Strong growth supported by disciplined cost control
Lower content costs contribute to EBITDA growth
TELENET:
Tough comparison with wage inflation of +3.6% from
January and higher network costs
Price adjustments and cost control to drive
subsequent growth
VMO2(2) TRANSACTION ADJ.
EBITDA GROWTH (%)
3.6%
Q1'21
5.7%
4.9%
FY'20
Q2'21
VODAFONEZIGGO (²)
EBITDA GROWTH (%)
(0.6%) (3.8%)
Q3'21
2.8%
(2.1%)
2.4%
Q4'21
5.1%
FY¹21
2.0%
(VirgiO₂)
Includes
$14m
CTC
2.2%
Q1'22
OZ
2.1%
Q1'21 Q2'21 Q3'21 Q4'21 FY'21 Q1'22
SUNRISE UPC
EBITDA GROWTH (%)
(10.5%)
(7.3%)
(3.1%)
0.2%
FY'20 Q1'21 Q2'21 Q3'21
3.3%
TELENET
EBITDA GROWTH (%)
3.2% 0.6%
(0.4%)
(0.5%)
Q4'21
1.6%
FY'20 Q1'21 Q2'21 Q3'21 Q4'21
(1) YOY growth rates presented on a rebased basis for VodafoneZiggo, Telenet and Sunrise UPC. VMO2 JV YOY growth rates based on IFRS transaction adjusted pro forma results as if the VMO2 JV was created on January 1, 2020. VMO2 YoY growth rates
are shown on an FX neutral basis. IFRS results as reported by the VMO2 JV and US GAAP results differ significantly and are not comparable. See the Appendix for additional information and reconciliations.
(2) Non-consolidated 50% owned JVs. Reflects 100% of VodafoneZiggo and VMO2.
Sunrise upc
(1.8%) Includes $
5m CTC
FY'21
1.2%
9.6%
FY'21
Q1'22
A
(1.7%)
Q1'22View entire presentation