Asos Results Presentation Deck
© 2023 asos
Key financials by segment
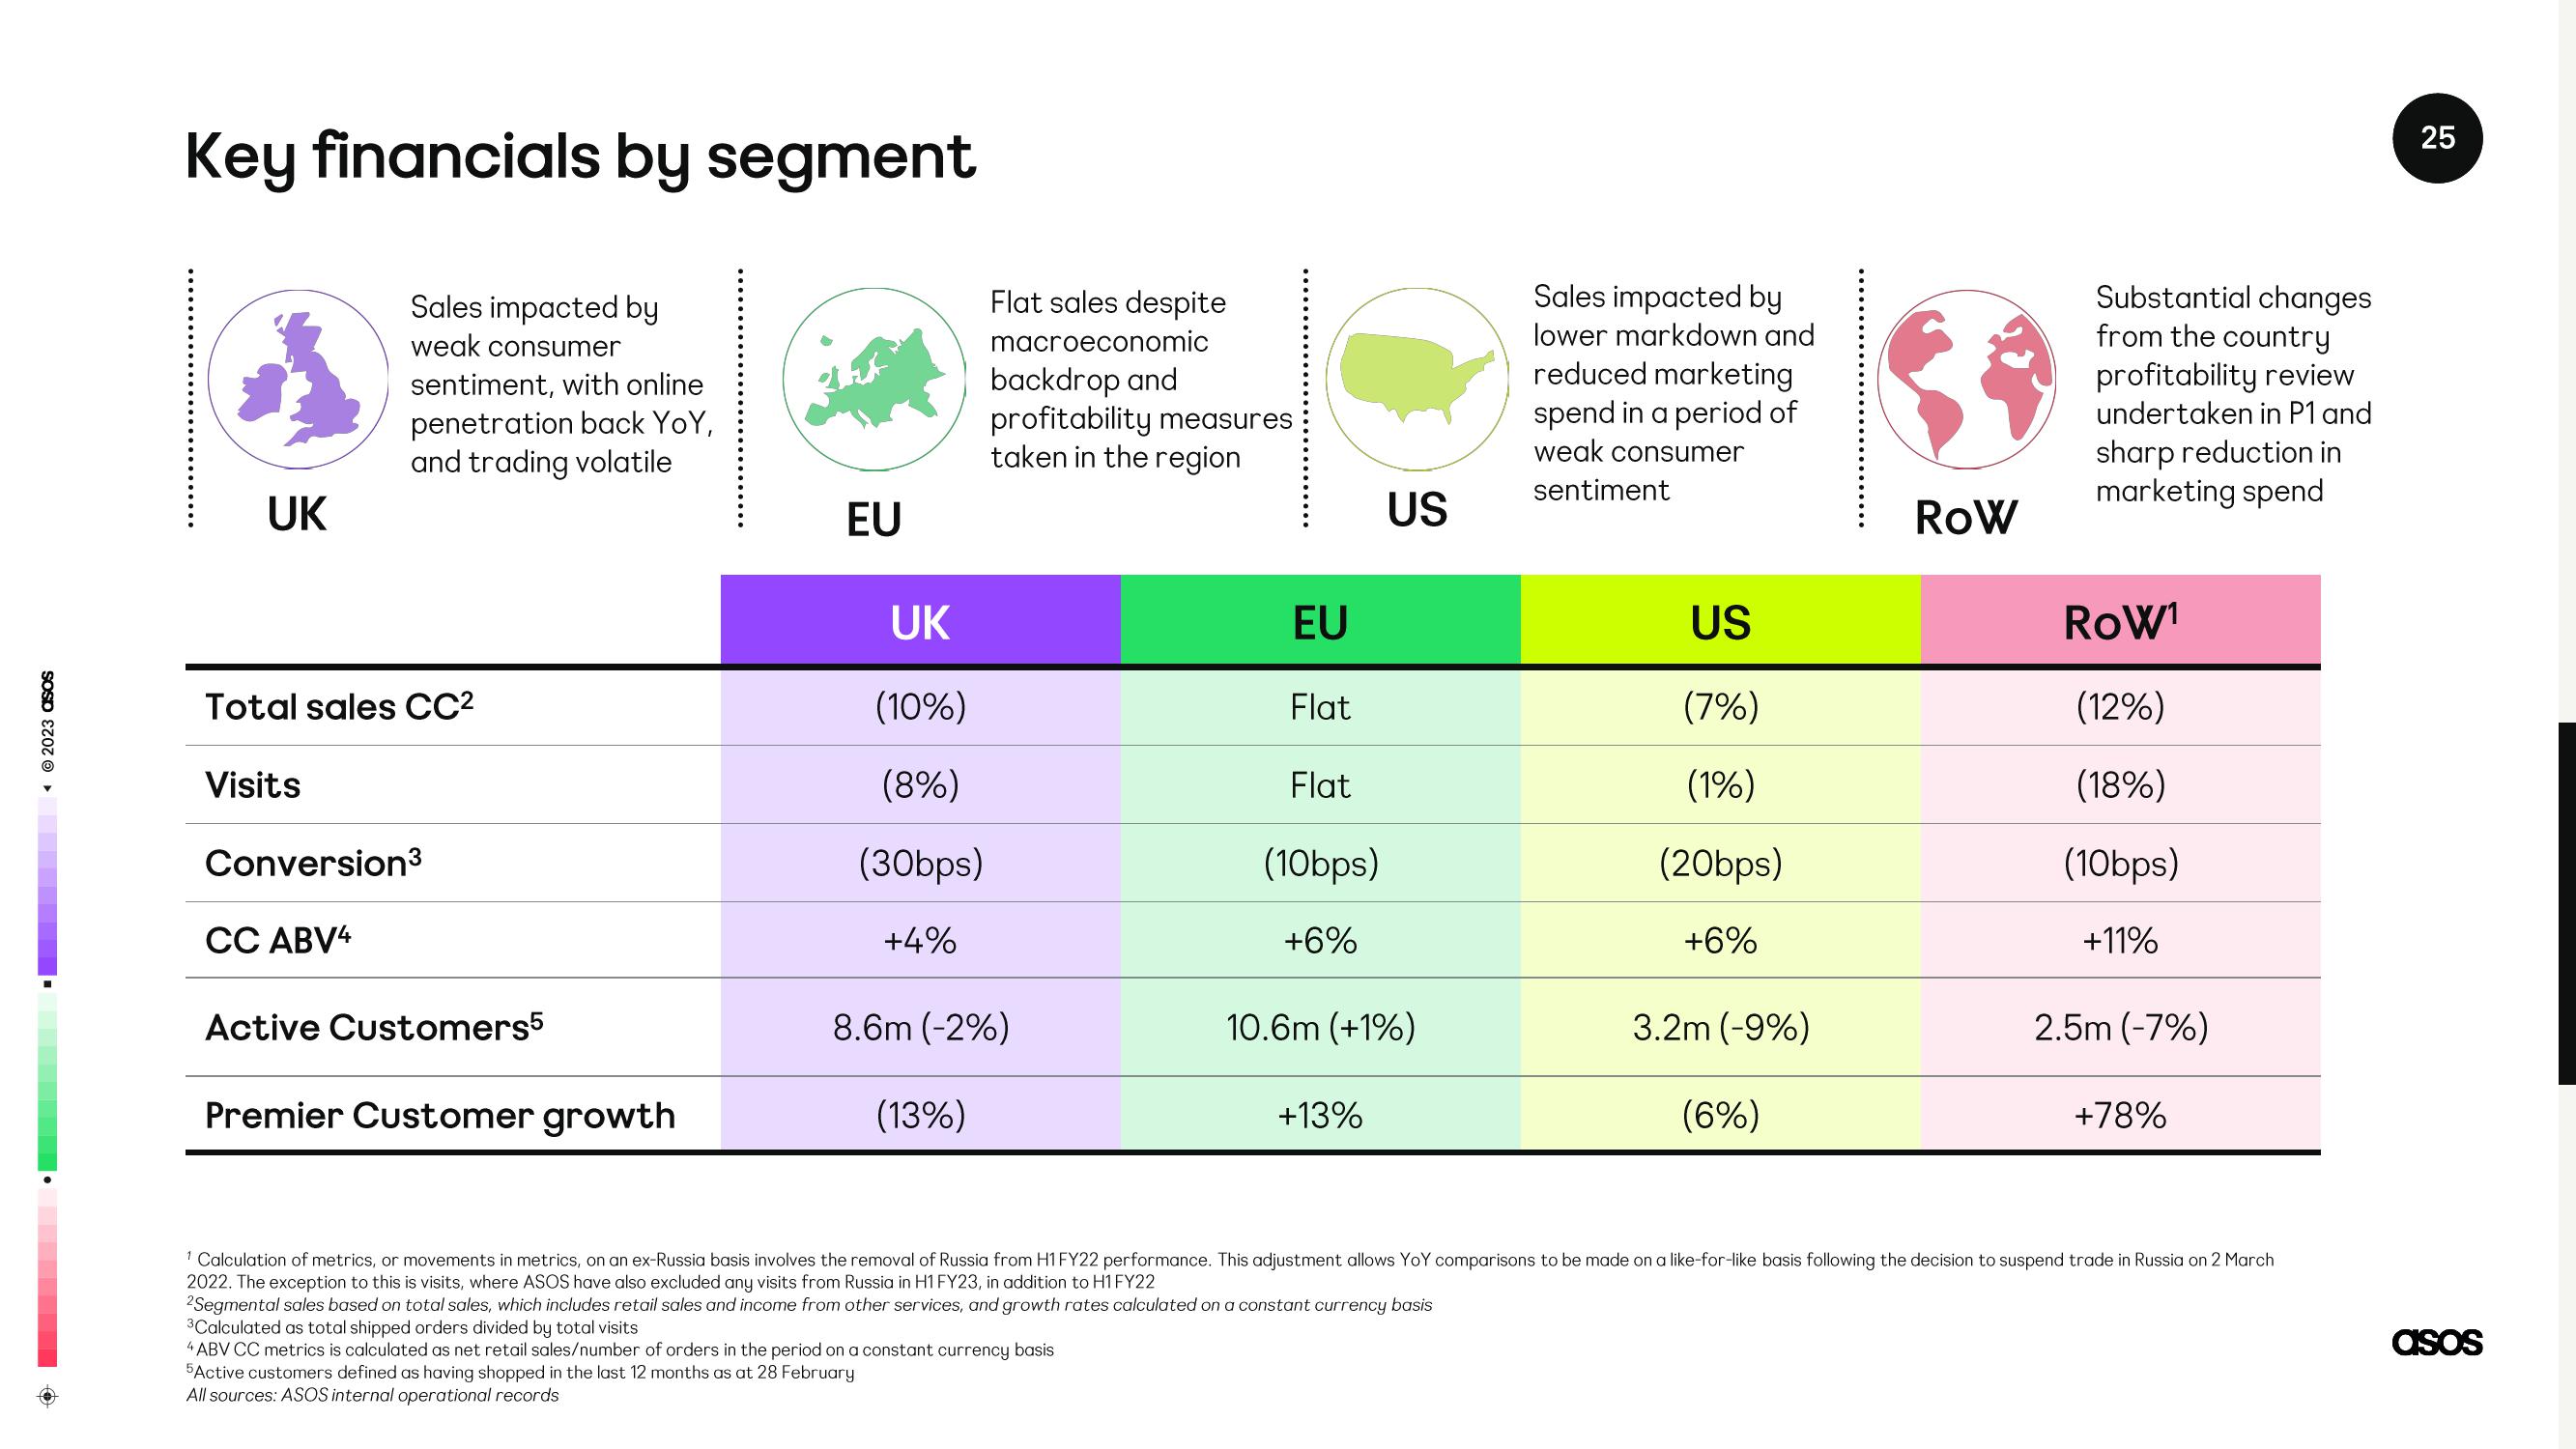
Sales impacted by
weak consumer
sentiment, with online
penetration back YoY,
and trading volatile
UK
Total sales CC²
Visits
Conversion³
CC ABV4
Active Customers5
Premier Customer growth
EU
UK
(10%)
(8%)
(30bps)
+4%
Flat sales despite
macroeconomic
(13%)
backdrop and
profitability measures
taken in the region
8.6m (-2%)
EU
Flat
Flat
(10bps)
+6%
US
10.6m (+1%)
+13%
Sales impacted by
lower markdown and
reduced marketing
spend in a period of
weak consumer
sentiment
2Segmental sales based on total sales, which includes retail sales and income from other services, and growth rates calculated on a constant currency basis
3Calculated as total shipped orders divided by total visits
4ABV CC metrics is calculated as net retail sales/number of orders in the period on a constant currency basis
5Active customers defined as having shopped in the last 12 months as at 28 February
All sources: ASOS internal operational records
US
(7%)
(1%)
(20bps)
+6%
3.2m (-9%)
(6%)
ROW
Substantial changes
from the country
profitability review
undertaken in P1 and
sharp reduction in
marketing spend
RoW¹
(12%)
(18%)
(10bps)
+11%
2.5m (-7%)
+78%
1 Calculation of metrics, or movements in metrics, on an ex-Russia basis involves the removal of Russia from H1 FY22 performance. This adjustment allows YoY comparisons to be made on a like-for-like basis following the decision to suspend trade in Russia on 2 March
2022. The exception to this is visits, where ASOS have also excluded any visits from Russia in H1 FY23, in addition to H1 FY22
25
asosView entire presentation