dLocal Results Presentation Deck
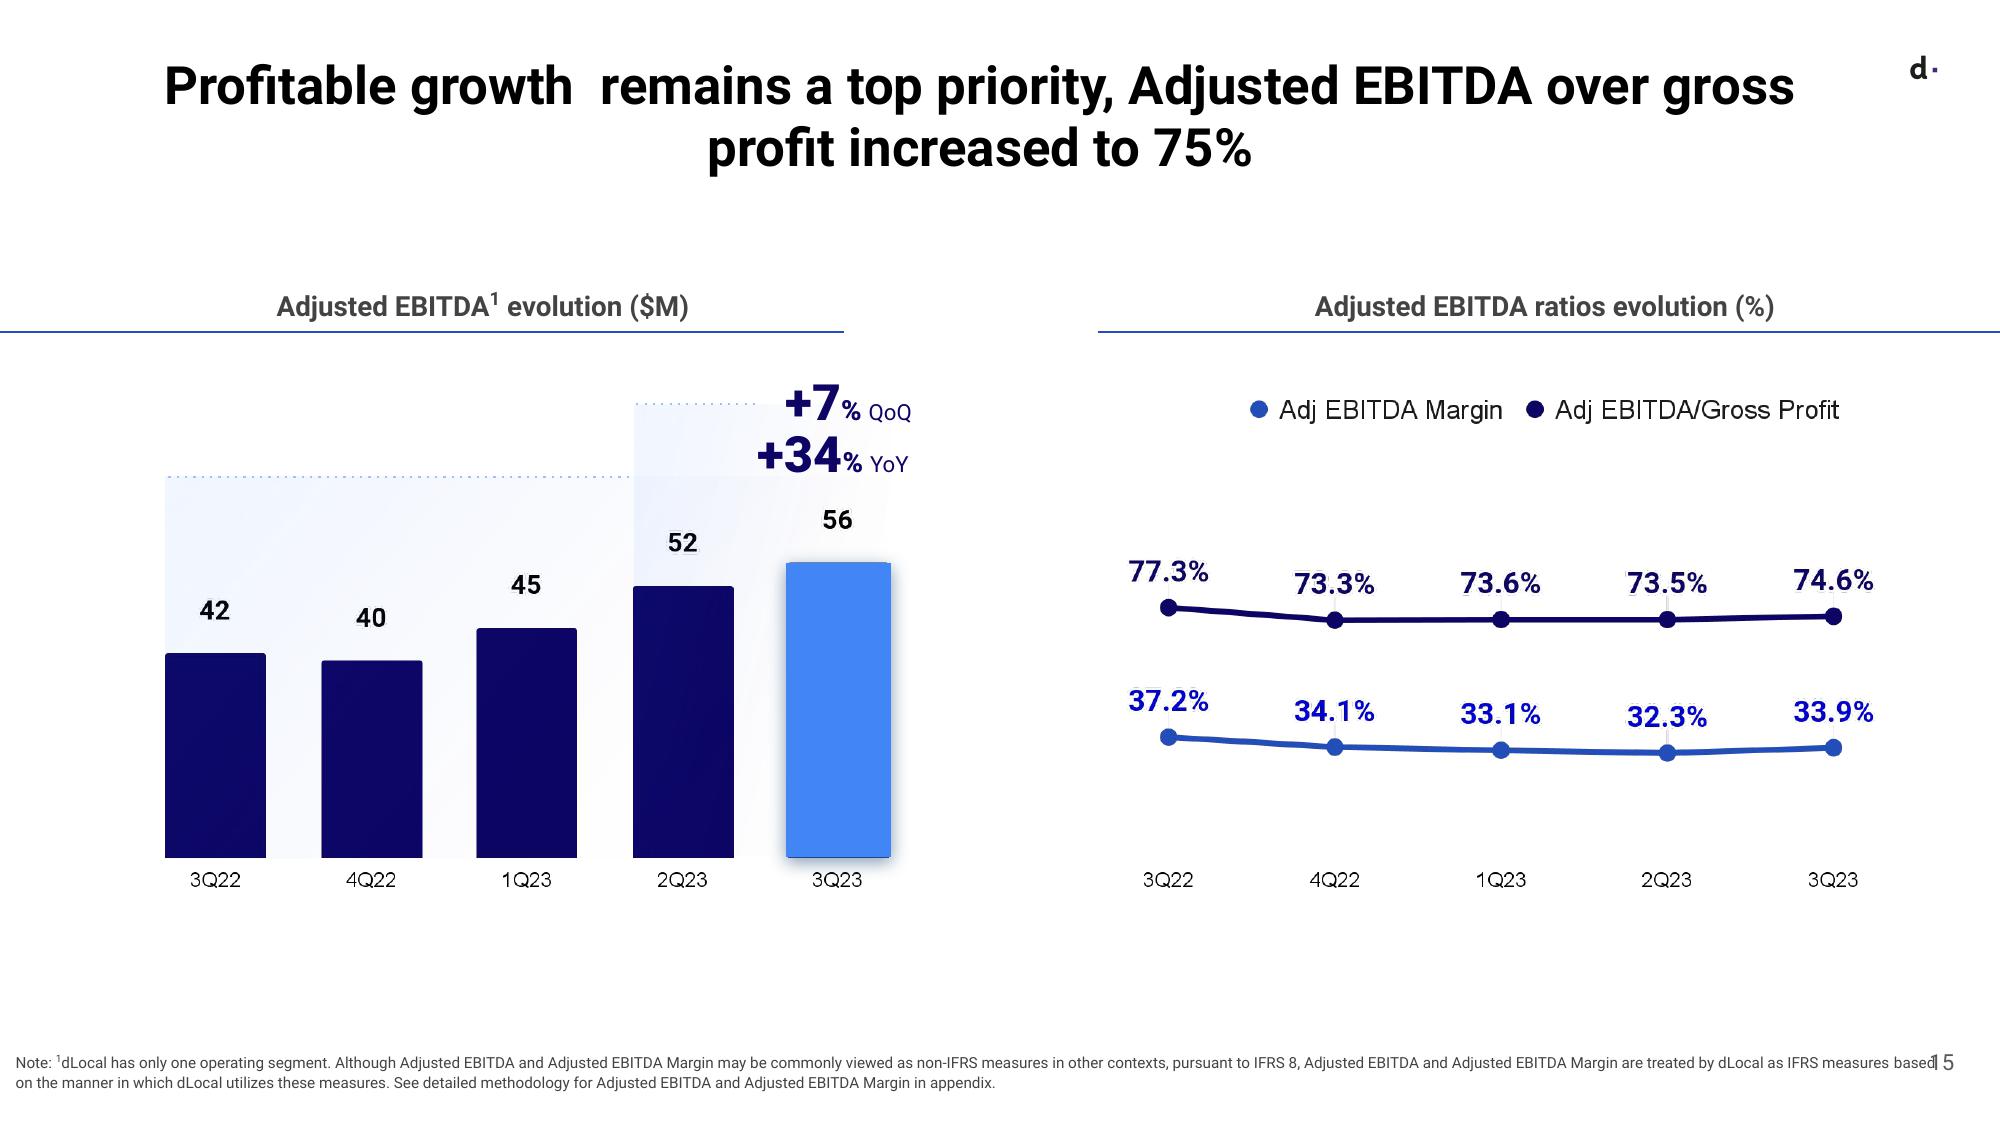
Profitable growth remains a top priority, Adjusted EBITDA over gross
profit increased to 75%
42
3Q22
Adjusted EBITDA¹ evolution ($M)
40
4Q22
45
1Q23
52
2Q23
+7% QOQ
+34% YOY
56
1
3Q23
77.3%
37.2%
3Q22
Adjusted EBITDA ratios evolution (%)
Adj EBITDA Margin Adj EBITDA/Gross Profit
73.3%
34.1%
4Q22
73.6%
33.1%
1Q23
73.5%
32.3%
2Q23
74.6%
33.9%
3Q23
d.
Note: 'dLocal has only one operating segment. Although Adjusted EBITDA and Adjusted EBITDA Margin may be commonly viewed as non-IFRS measures in other contexts, pursuant to IFRS 8, Adjusted EBITDA and Adjusted EBITDA Margin are treated by dLocal as IFRS measures based 5
on the manner in which dLocal utilizes these measures. See detailed methodology for Adjusted EBITDA and Adjusted EBITDA Margin in appendix.View entire presentation