Bausch+Lomb Results Presentation Deck
Cash Flow and Balance Sheet Summary
Cash flow from operations.
Adj. Cash flow from operations (non-GAAP)1,3
CapEx
Debt²
4Q22
$159M
$167M
$50M
$2,488M
FY22
$345M
BAUSCH + LOMB 1. This is a non-GAAP measure or ratio. See Slide 2 and Appendix for further information on non-GAAP measures and ratios.
2. Debt Balance shown at Principal Value outstanding as of 12/31/2022.
3. Adjusted cash flow from operations (non-GAAP) is Cash flow from operations, its most closely associated GAAP measure, less separation and separation-related payments of $8 million for 4Q22 and $38 million FY22.
$383M
$175M
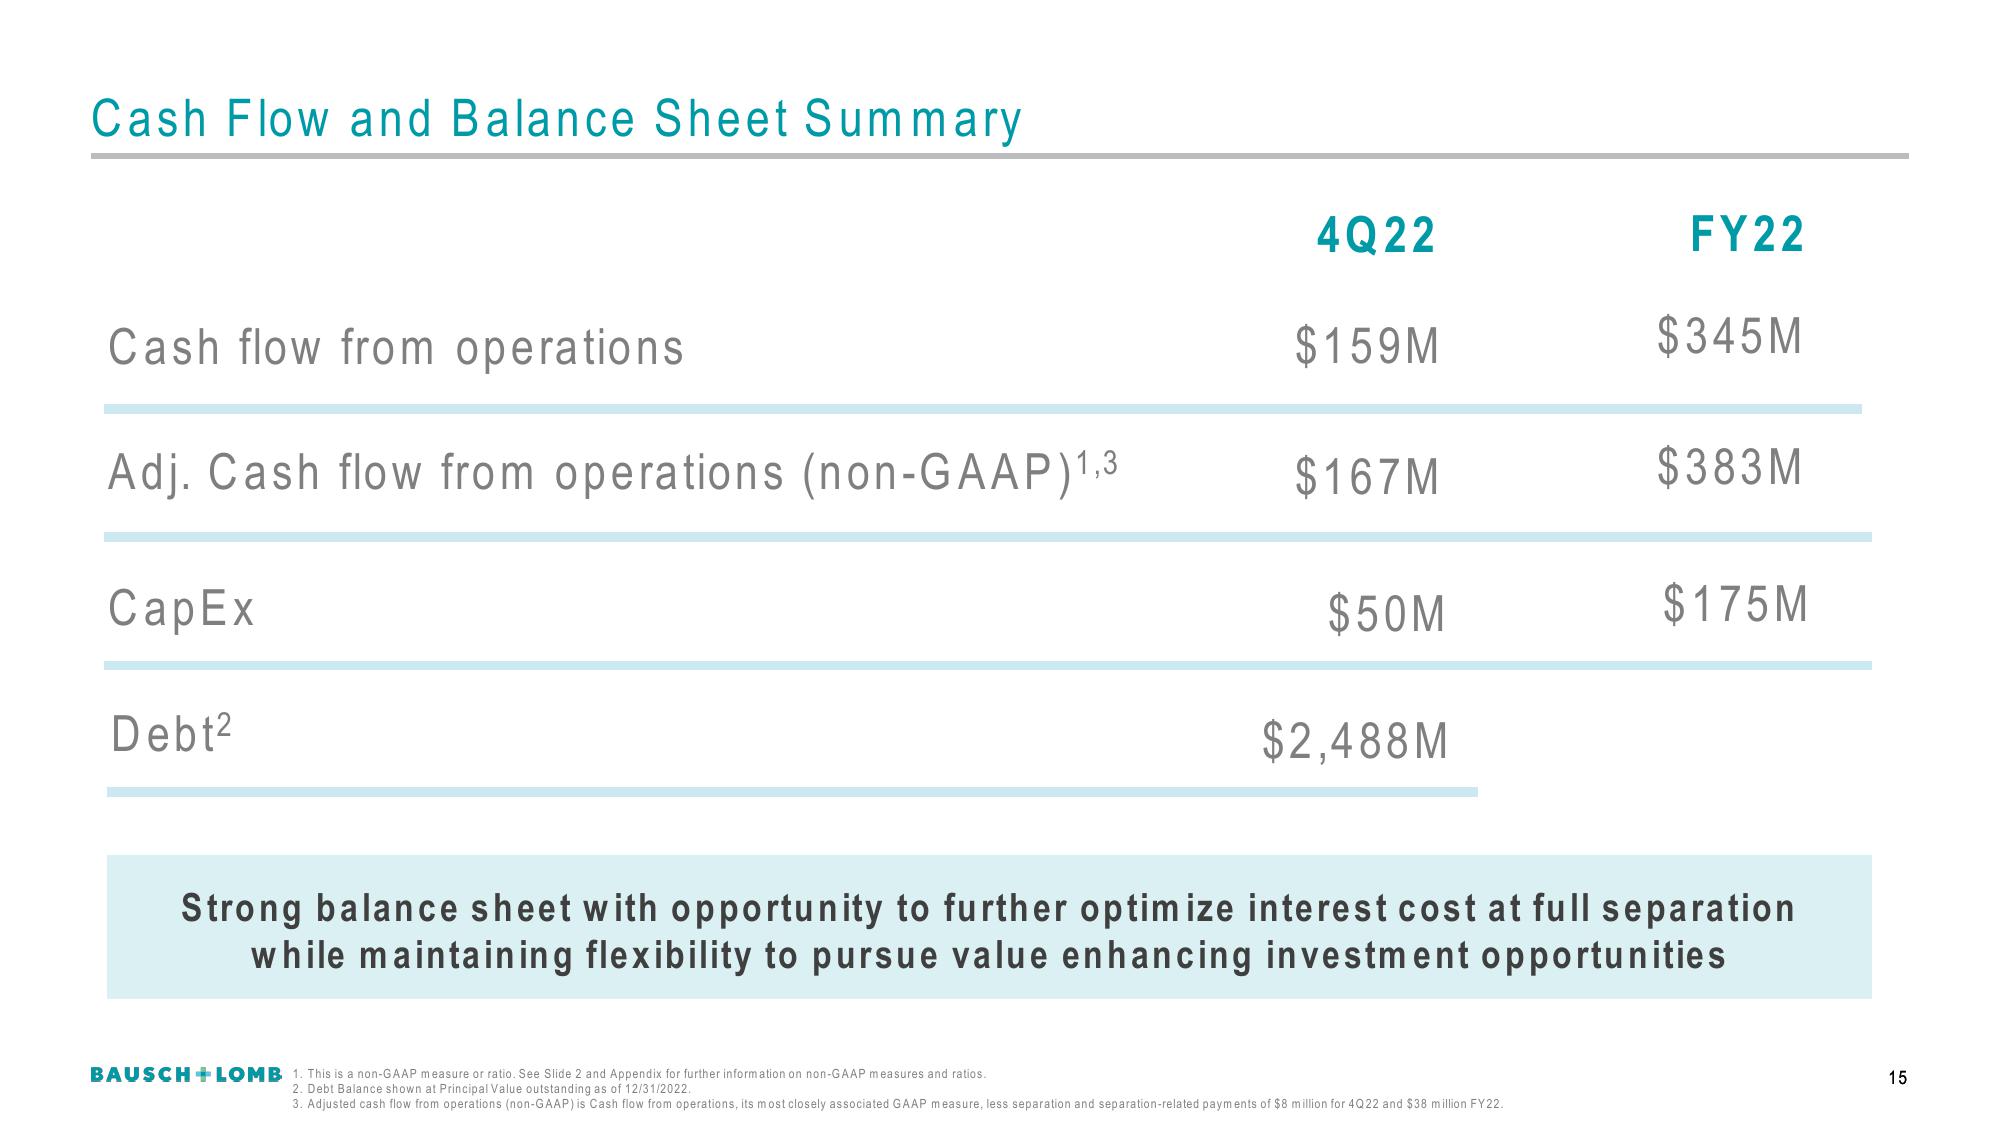
Strong balance sheet with opportunity to further optimize interest cost at full separation
while maintaining flexibility to pursue value enhancing investment opportunities
15View entire presentation