MoneyLion Results Presentation Deck
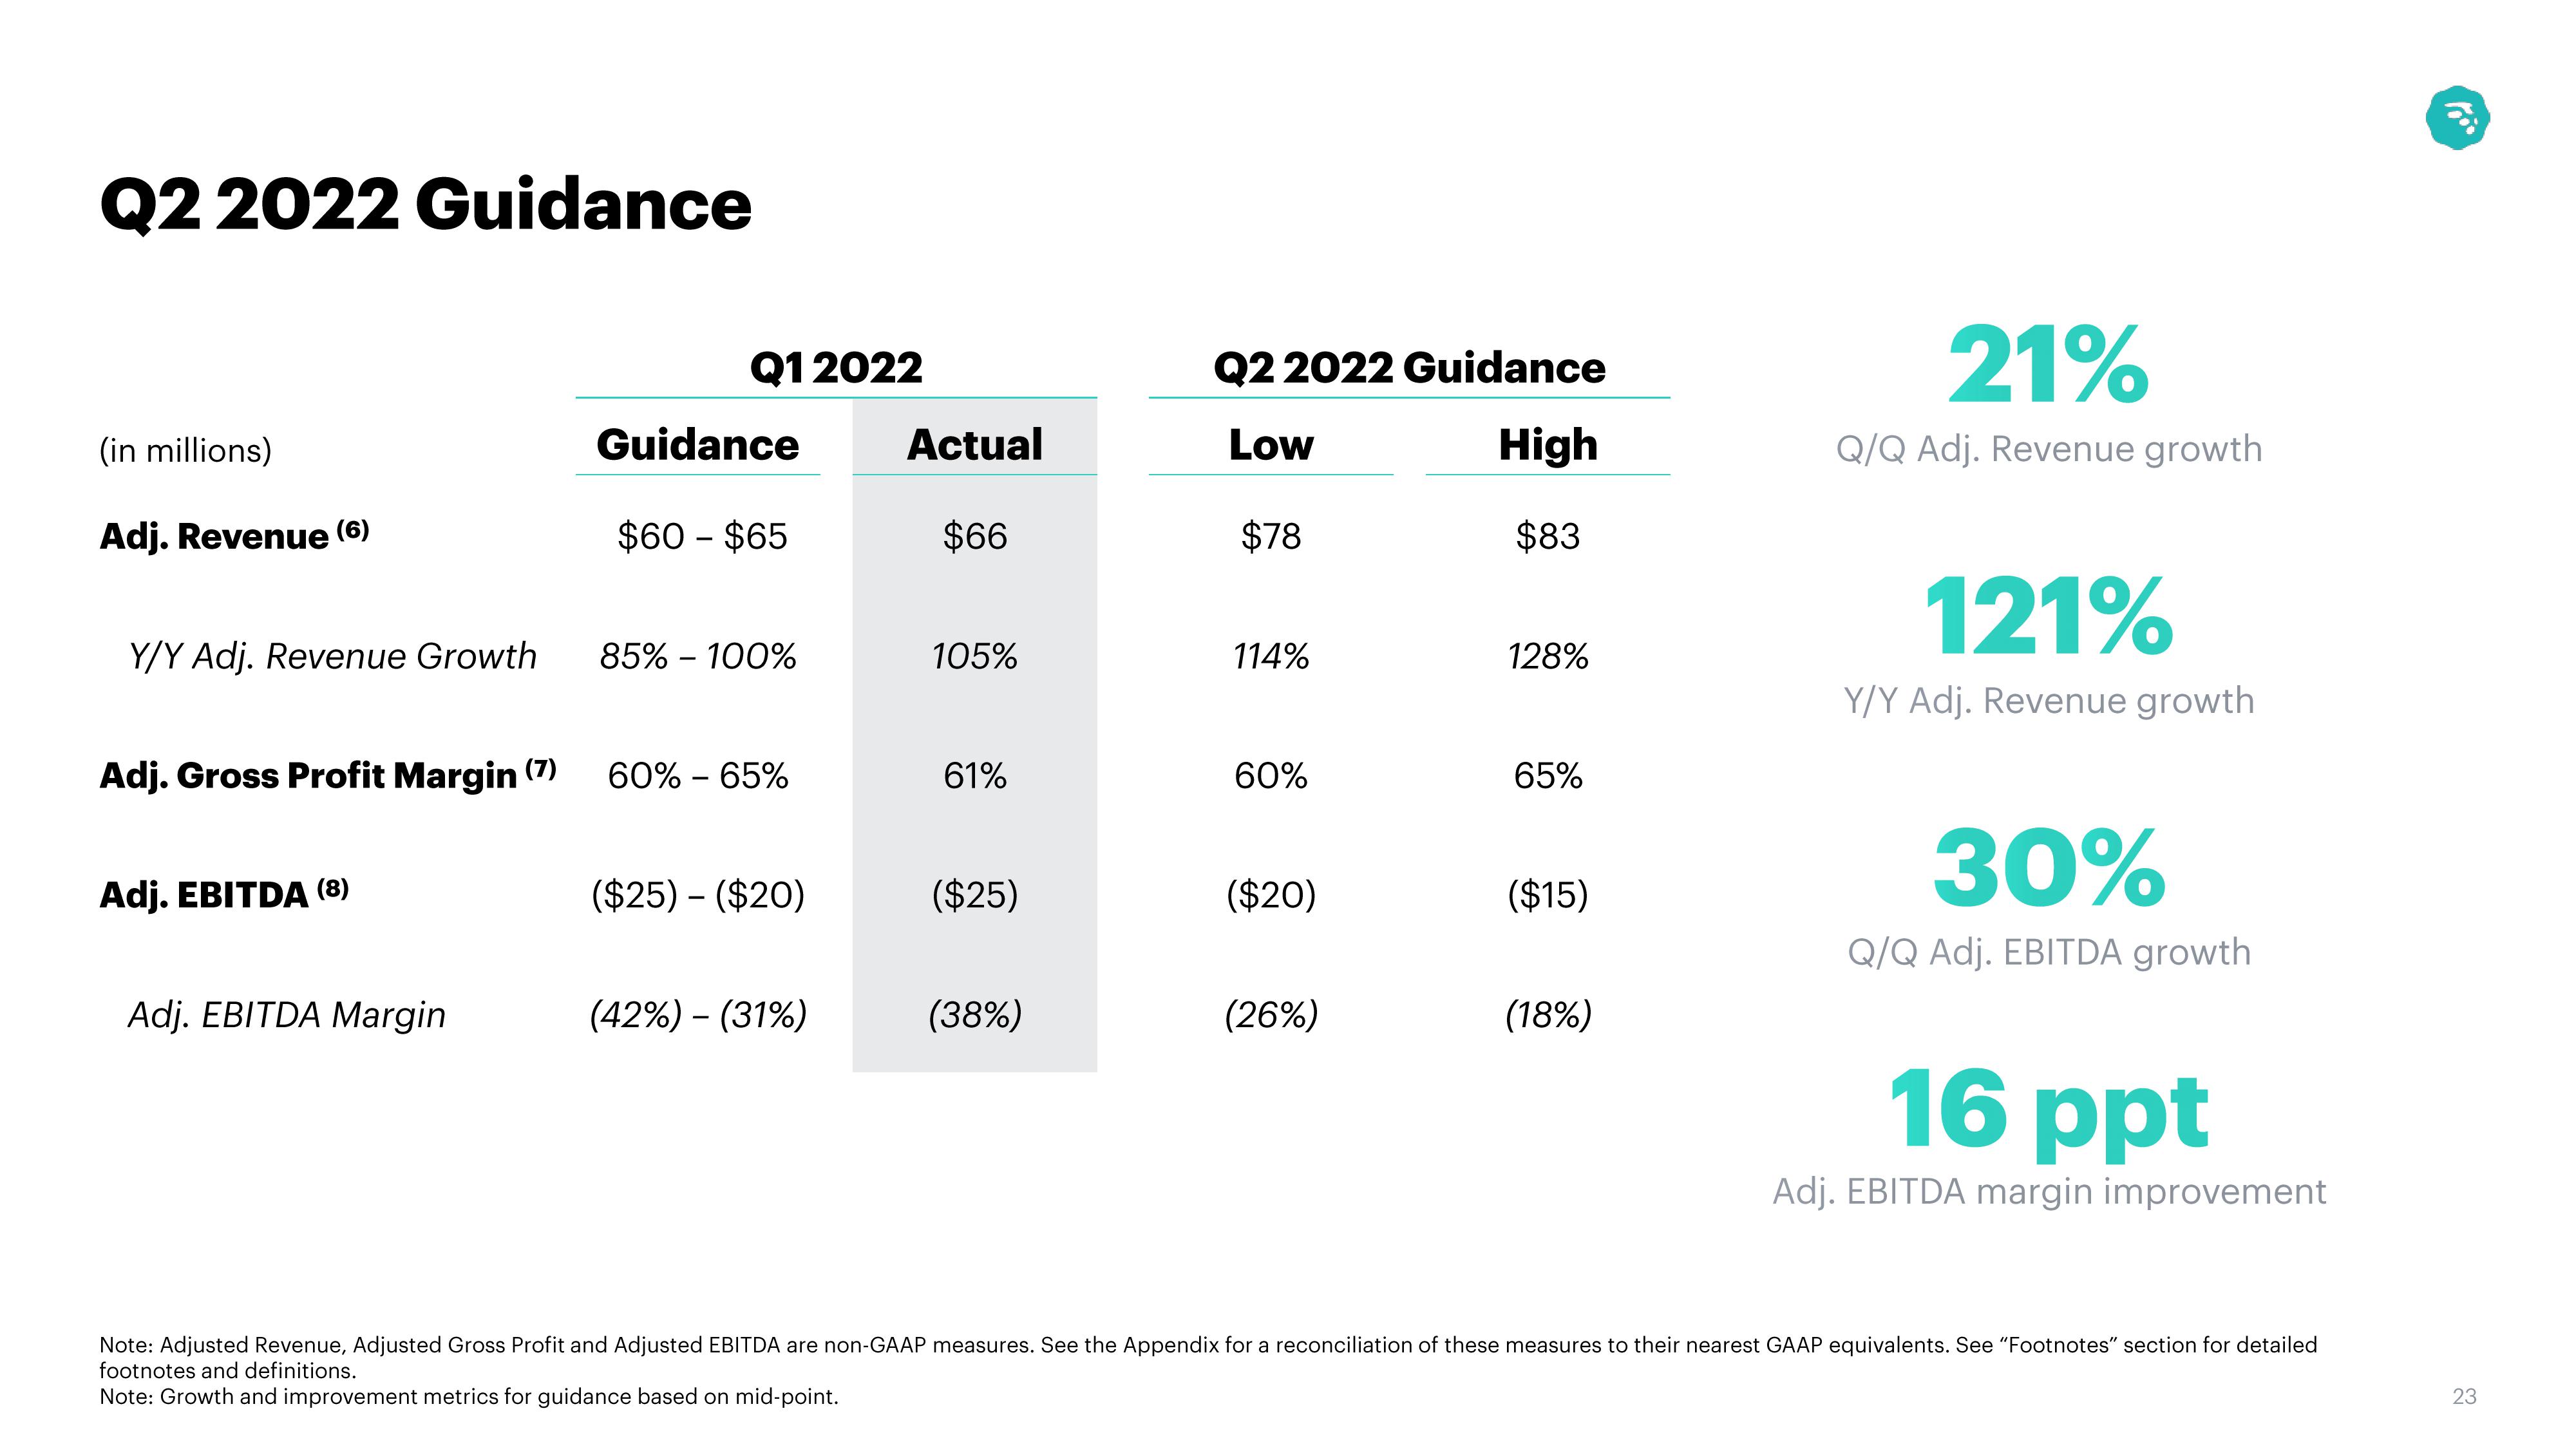
Q2 2022 Guidance
(in millions)
Adj. Revenue (6)
Y/Y Adj. Revenue Growth
Adj. Gross Profit Margin (7)
Adj. EBITDA (8)
Adj. EBITDA Margin
Q1 2022
Guidance
$60 - $65
85% - 100%
60% - 65%
($25) - ($20)
(42%) - (31%)
Actual
$66
105%
61%
($25)
(38%)
Q2 2022 Guidance
Low
High
$78
$83
114%
60%
($20)
(26%)
128%
65%
($15)
(18%)
21%
Q/Q Adj. Revenue growth
121%
Y/Y Adj. Revenue growth
30%
Q/Q Adj. EBITDA growth
16 ppt
Adj. EBITDA margin improvement
Note: Adjusted Revenue, Adjusted Gross Profit and Adjusted EBITDA are non-GAAP measures. See the Appendix for a reconciliation of these measures to their nearest GAAP equivalents. See "Footnotes" section for detailed
footnotes and definitions.
Note: Growth and improvement metrics for guidance based on mid-point.
10⁰
23View entire presentation