Appreciate SPAC Presentation Deck
APPENDIX
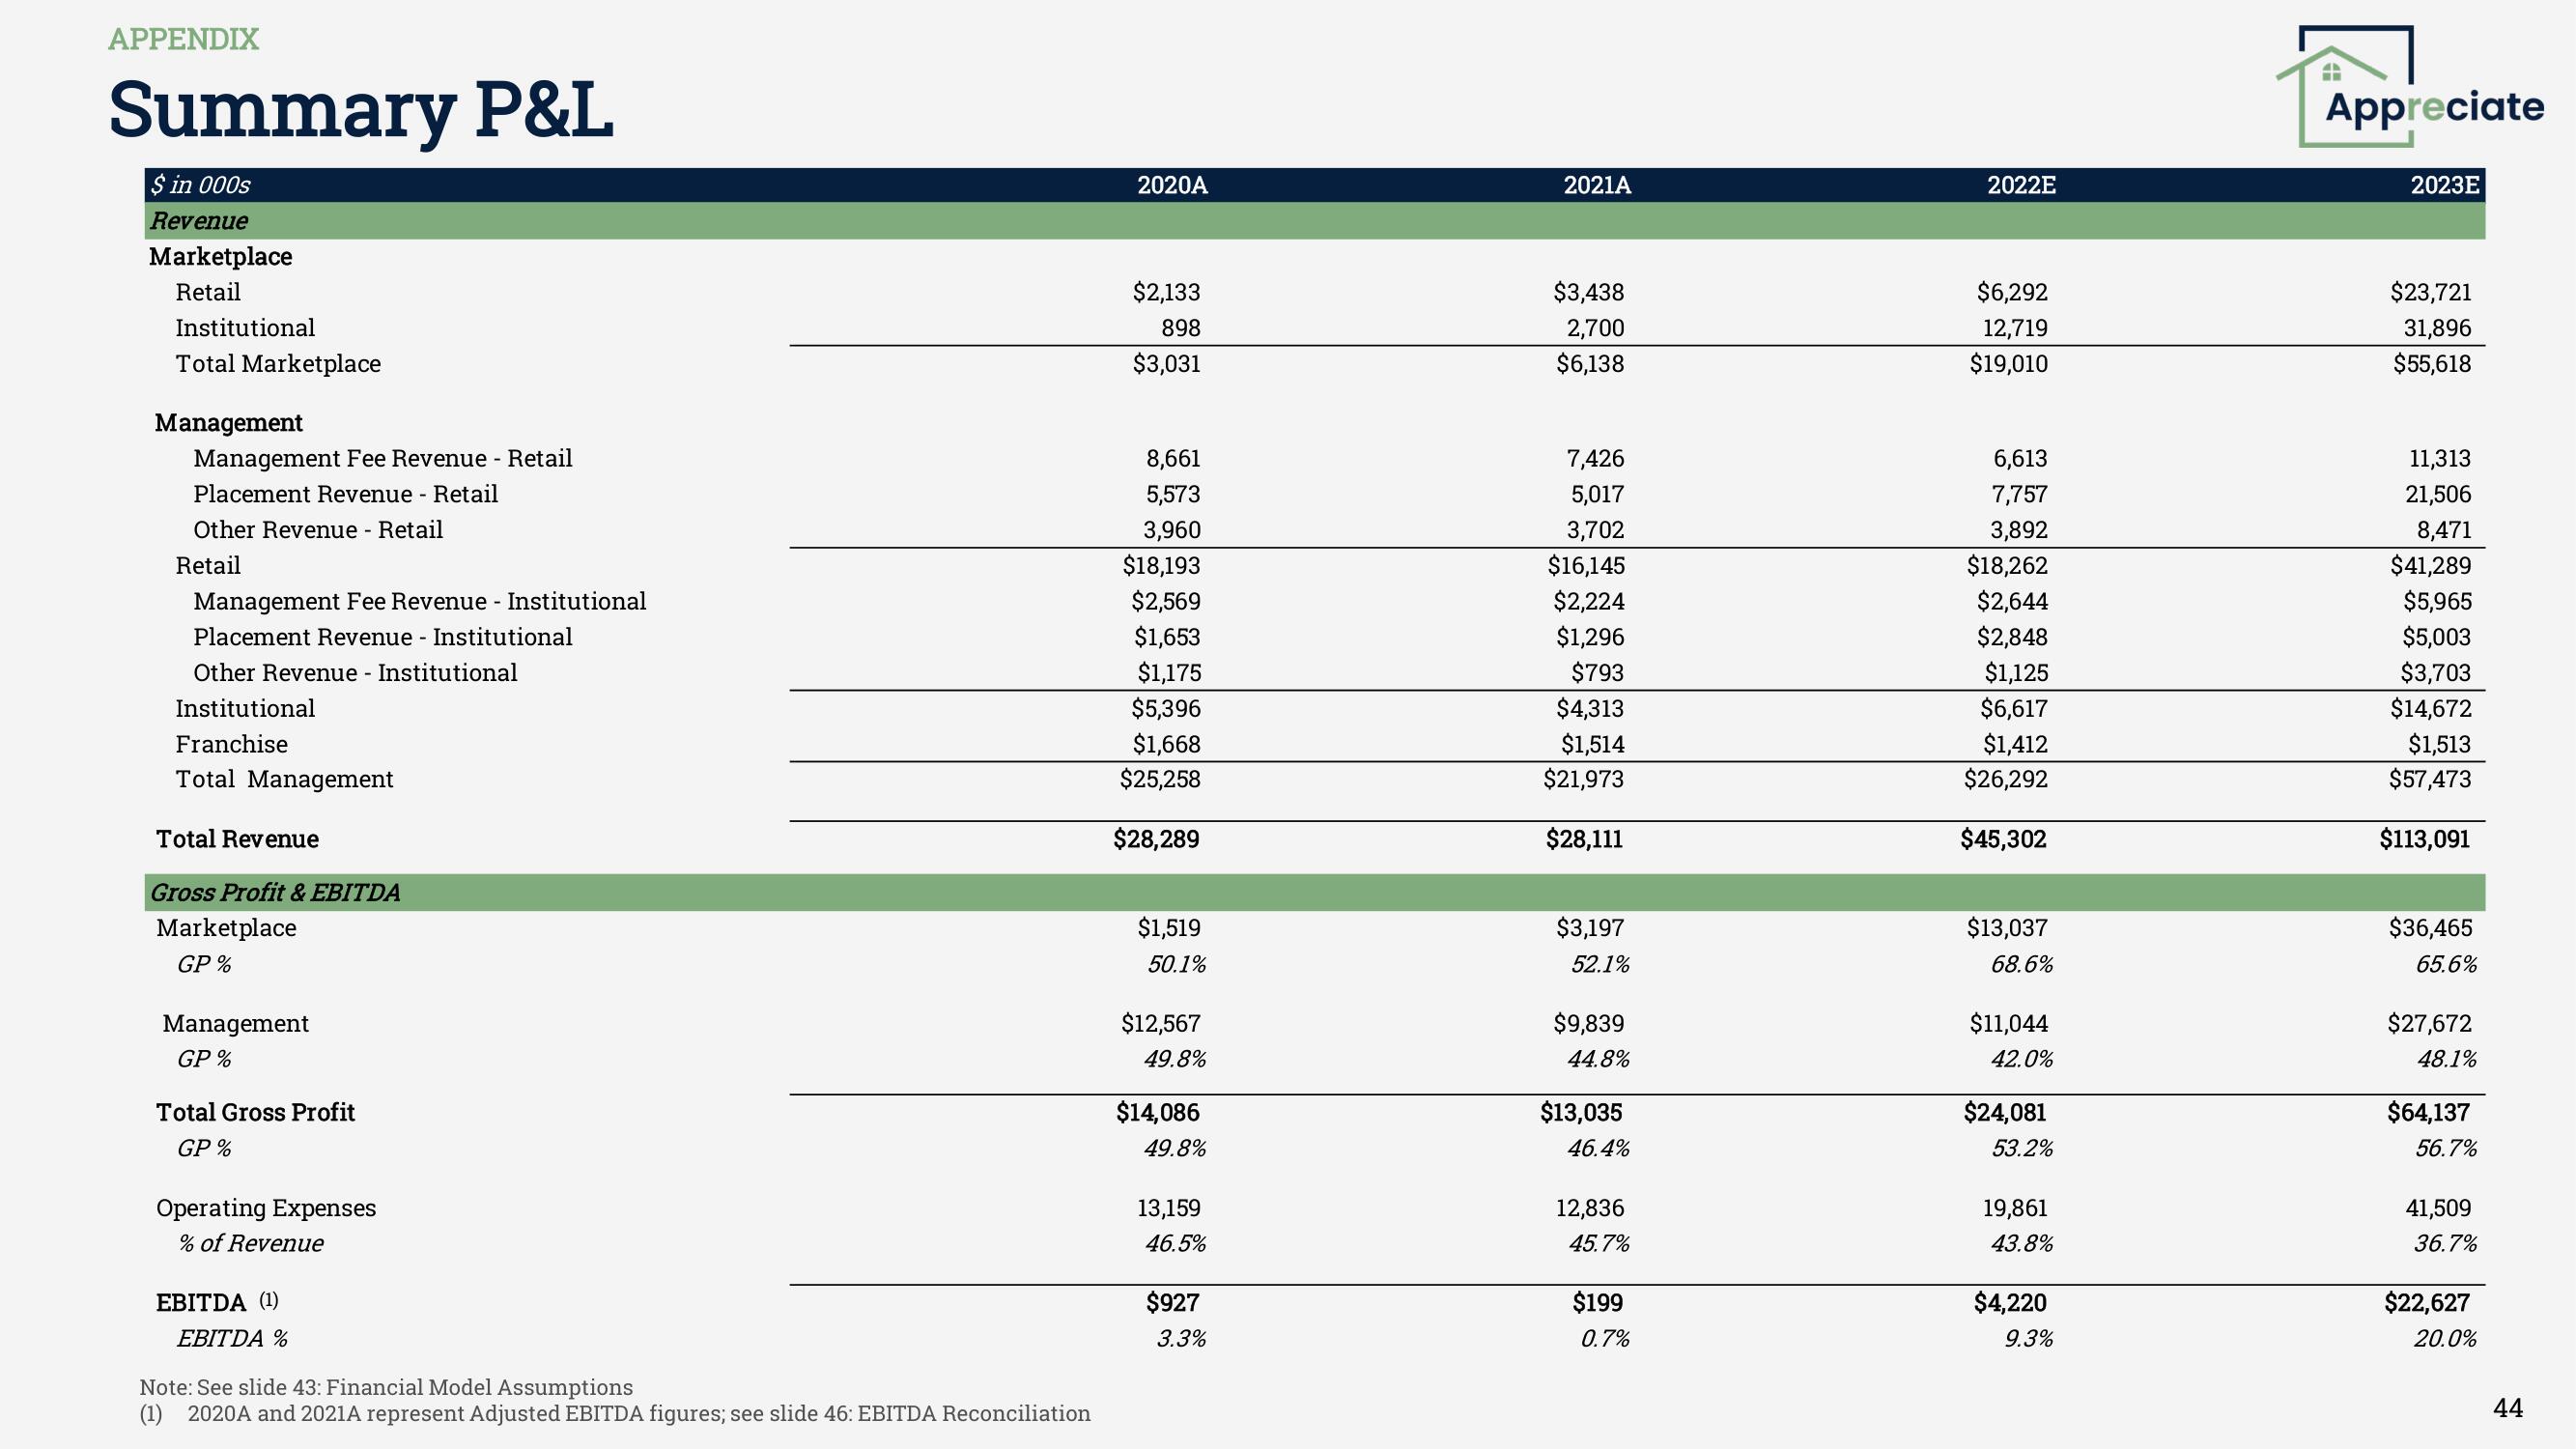
Summary P&L
$ in 000s
Revenue
Marketplace
Retail
Institutional
Total Marketplace
Management
Management Fee Revenue - Retail
Placement Revenue - Retail
Other Revenue - Retail
Retail
Management Fee Revenue - Institutional
Placement Revenue - Institutional
Other Revenue - Institutional
Institutional
Franchise
Total Management
Total Revenue
Gross Profit & EBITDA
Marketplace
GP %
Management
GP %
Total Gross Profit
GP%
Operating Expenses
% of Revenue
EBITDA (1)
EBITDA %
Note: See slide 43: Financial Model Assumptions
(1) 2020A and 2021A represent Adjusted EBITDA figures; see slide 46: EBITDA Reconciliation
2020A
$2,133
898
$3,031
8,661
5,573
3,960
$18,193
$2,569
$1,653
$1,175
$5,396
$1,668
$25,258
$28,289
$1,519
50.1%
$12,567
49.8%
$14,086
49.8%
13,159
46.5%
$927
3.3%
2021A
$3,438
2,700
$6,138
7,426
5,017
3,702
$16,145
$2,224
$1,296
$793
$4,313
$1,514
$21,973
$28,111
$3,197
52.1%
$9,839
44.8%
$13,035
46.4%
12,836
45.7%
$199
0.7%
2022E
$6,292
12,719
$19,010
6,613
7,757
3,892
$18,262
$2,644
$2,848
$1,125
$6,617
$1,412
$26,292
$45,302
$13,037
68.6%
$11,044
42.0%
$24,081
53.2%
19,861
43.8%
$4,220
9.3%
4
Appreciate
2023E
$23,721
31,896
$55,618
11,313
21,506
8,471
$41,289
$5,965
$5,003
$3,703
$14,672
$1,513
$57,473
$113,091
$36,465
65.6%
$27,672
48.1%
$64,137
56.7%
41,509
36.7%
$22,627
20.0%
44View entire presentation