Teads IPO Presentation Deck
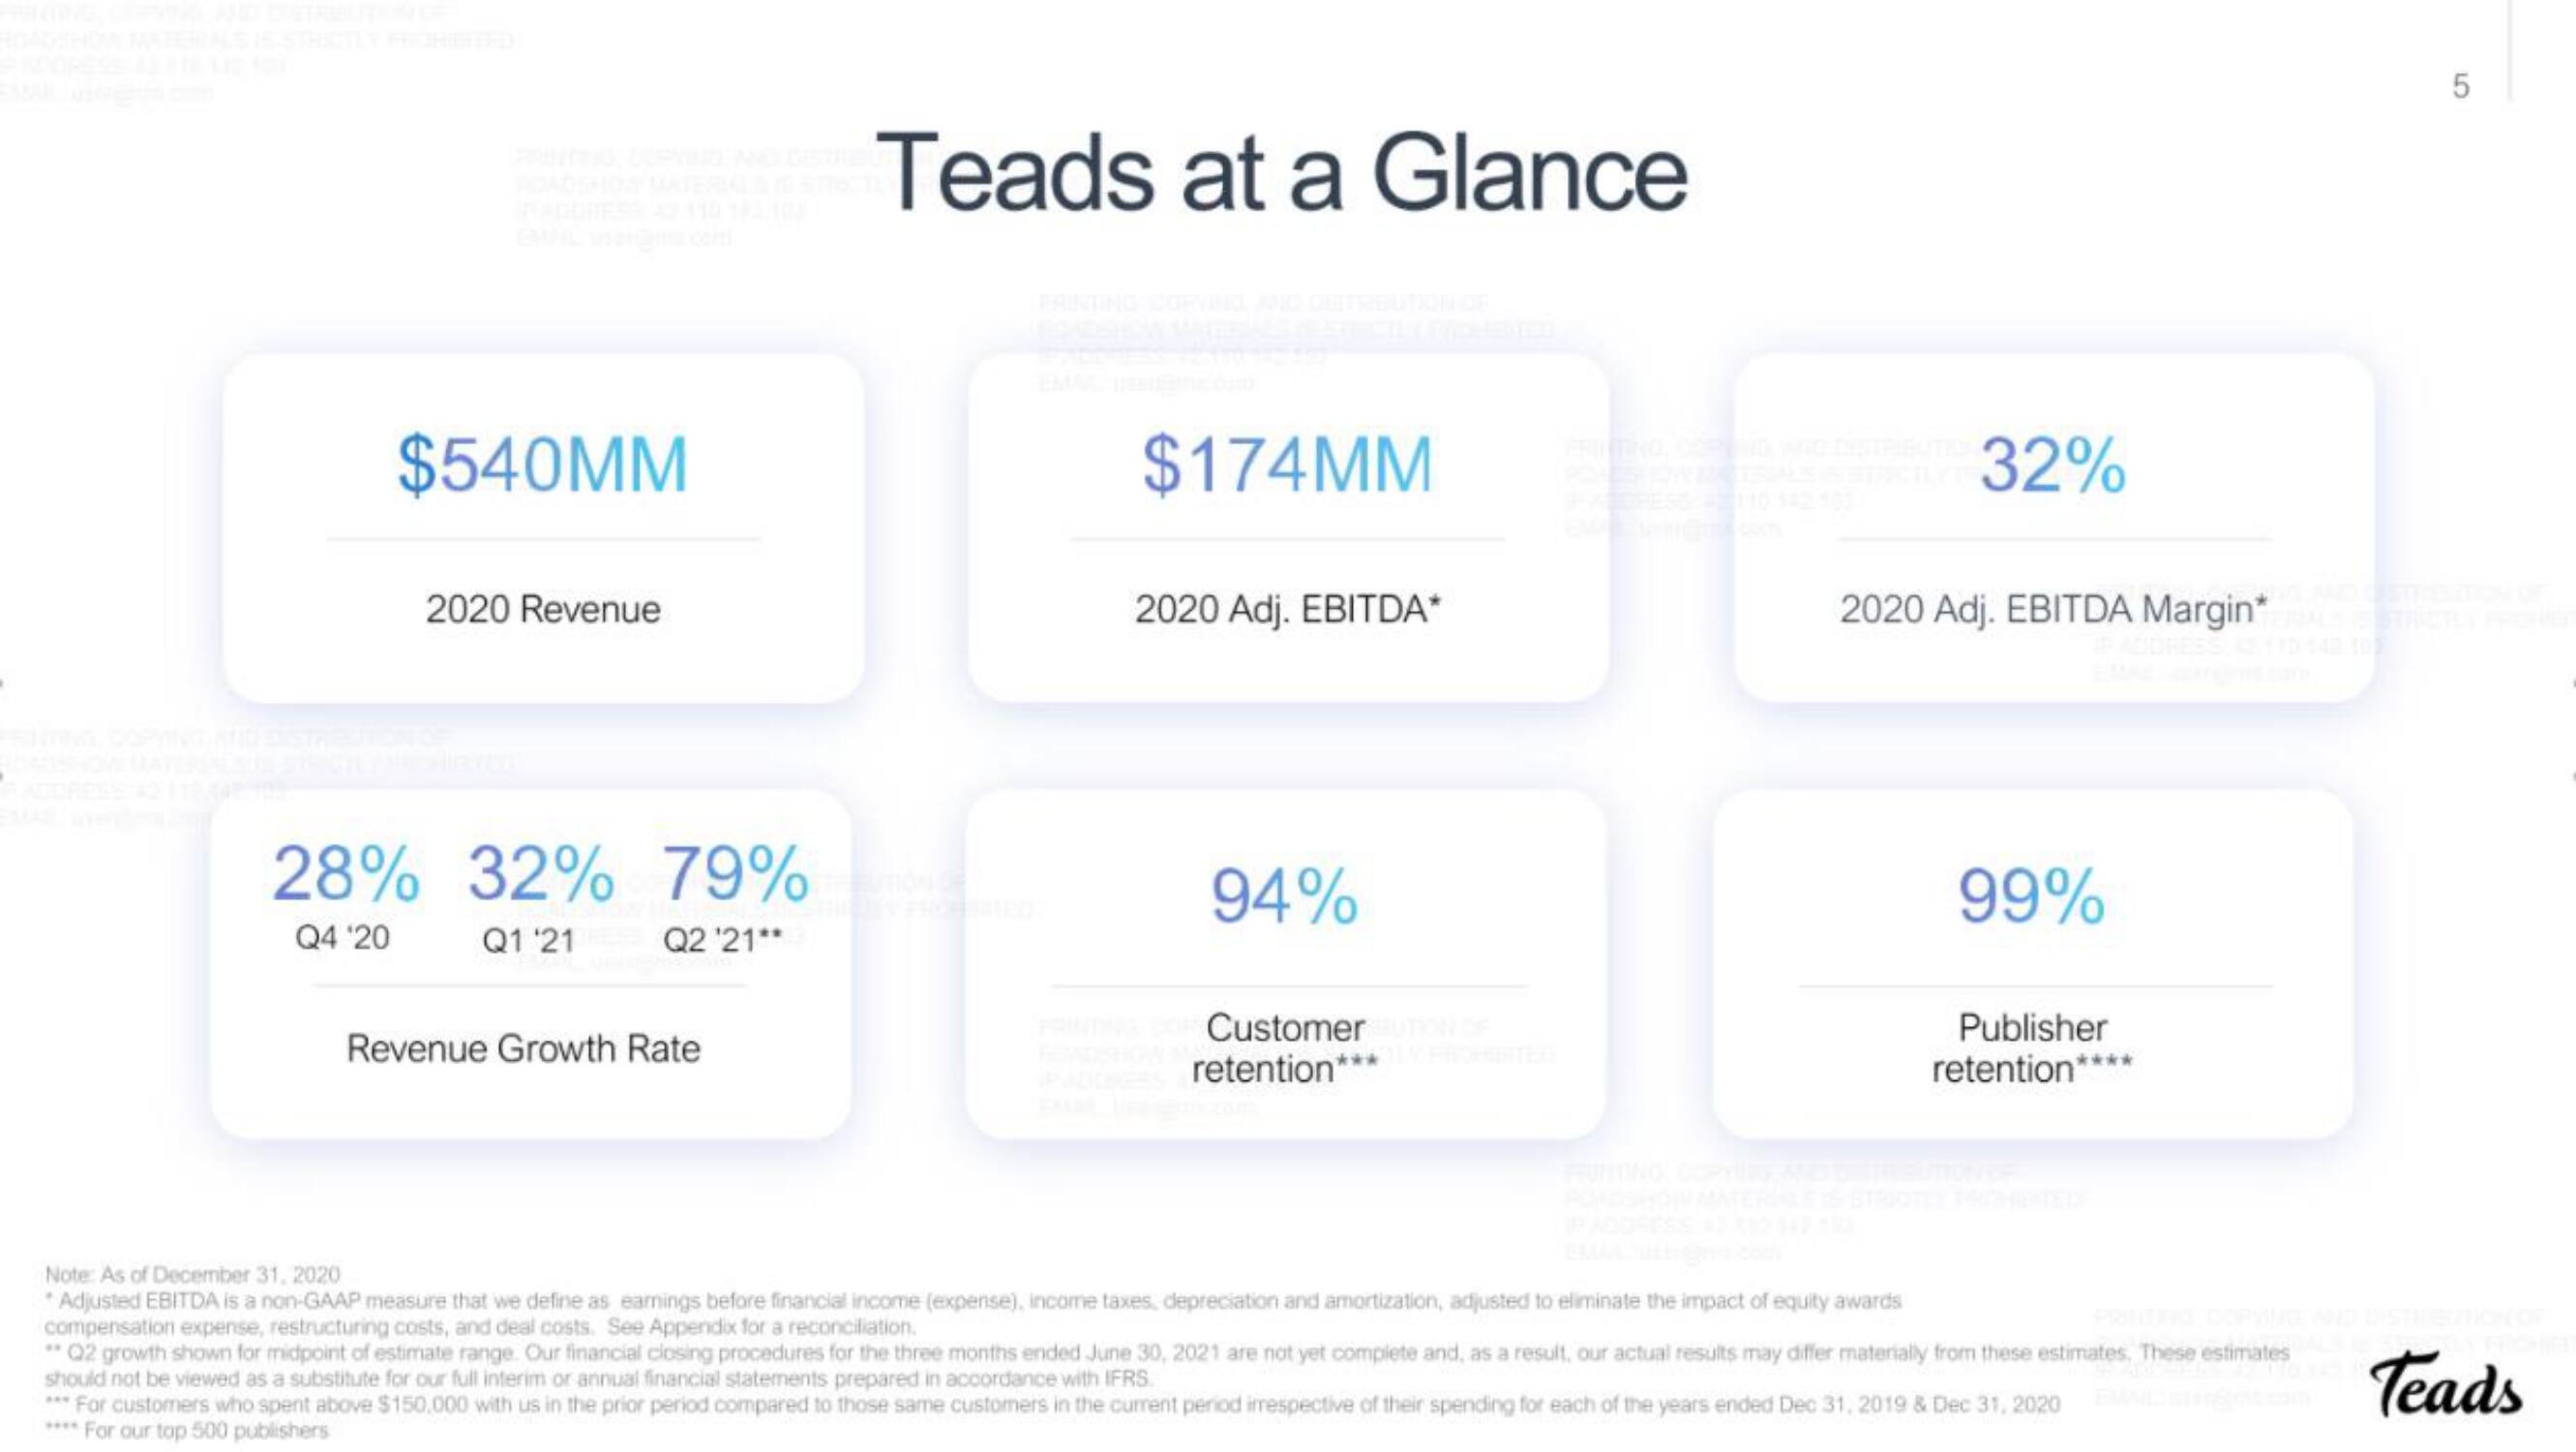
$540MM
2020 Revenue
28% 32% 79%
Q4 '20
Q1'21
Q2 '21**
Revenue Growth Rate
Teads at a Glance
$174MM
2020 Adj. EBITDA*
94%
Customer
retention*
FRITING, SELD WED CARENTE 32%
2020 Adj. EBITDA Margin*
99%
Publisher
retention*
Note: As of December 31, 2020
*Adjusted EBITDA is a non-GAAP measure that we define as earnings before financial income (expense), income taxes, depreciation and amortization, adjusted to eliminate the impact of equity awards
compensation expense, restructuring costs, and deal costs. See Appendix for a reconciliation.
"Q2 growth shown for midpoint of estimate range. Our financial closing procedures for the three months ended June 30, 2021 are not yet complete and, as a result, our actual results may differ materially from these estimates. These estimates
should not be viewed as a substitute for our full interim or annual financial statements prepared in accordance with IFRS.
*** For customers who spent above $150,000 with us in the prior period compared to those same customers in the current period irrespective of their spending for each of the years ended Dec 31, 2019 & Dec 31, 2020
**** For our top 500 publishers
5
TeadsView entire presentation