Babylon SPAC Presentation Deck
Our Clinicians are Provided with Advanced, Quality Tools
Our Industry-Recognized (¹) Clinician Quality
Dashboard...
Do you need help with this dashboend? Click.
Consultant ID
La p
babylon
4.3
44
15
35%
Most recent data Jun 24, 2000
Total Appointments
Dr Tat C
Mar2020
ents
Mar 2010
-Young
You Cancellation Rate
3
Avgl Mar Rating
447
GP Apprent
Apr 2020
1.5%
For 2001
sp
Apr 2025
Metric Definitions
Starting
46
45
132
May 2010
Pate Appomers
439
14%
Diagnosis Coding
UK Clinician Performance Dashboard
pa
you
90%
92%
Jun 2020
++
Prescription Rate
you
42%
41
Pr
DIN
Pandually
Tous
23529
50%
MY
25
Mar 232
You
Avg
Key Metrics
Referral Rate
you
Appet Langh
Total Canctions
Cancellation Rate
X
you
1.3%
[You Adjusted t
45
Punctually
you
90%
Mar 26 2020-242000
904
vd AbutedPuuty
31%
May 2000
Score
Jun 3000
coming soon
Total
00:09:58
00:10:08
↑↓ $1
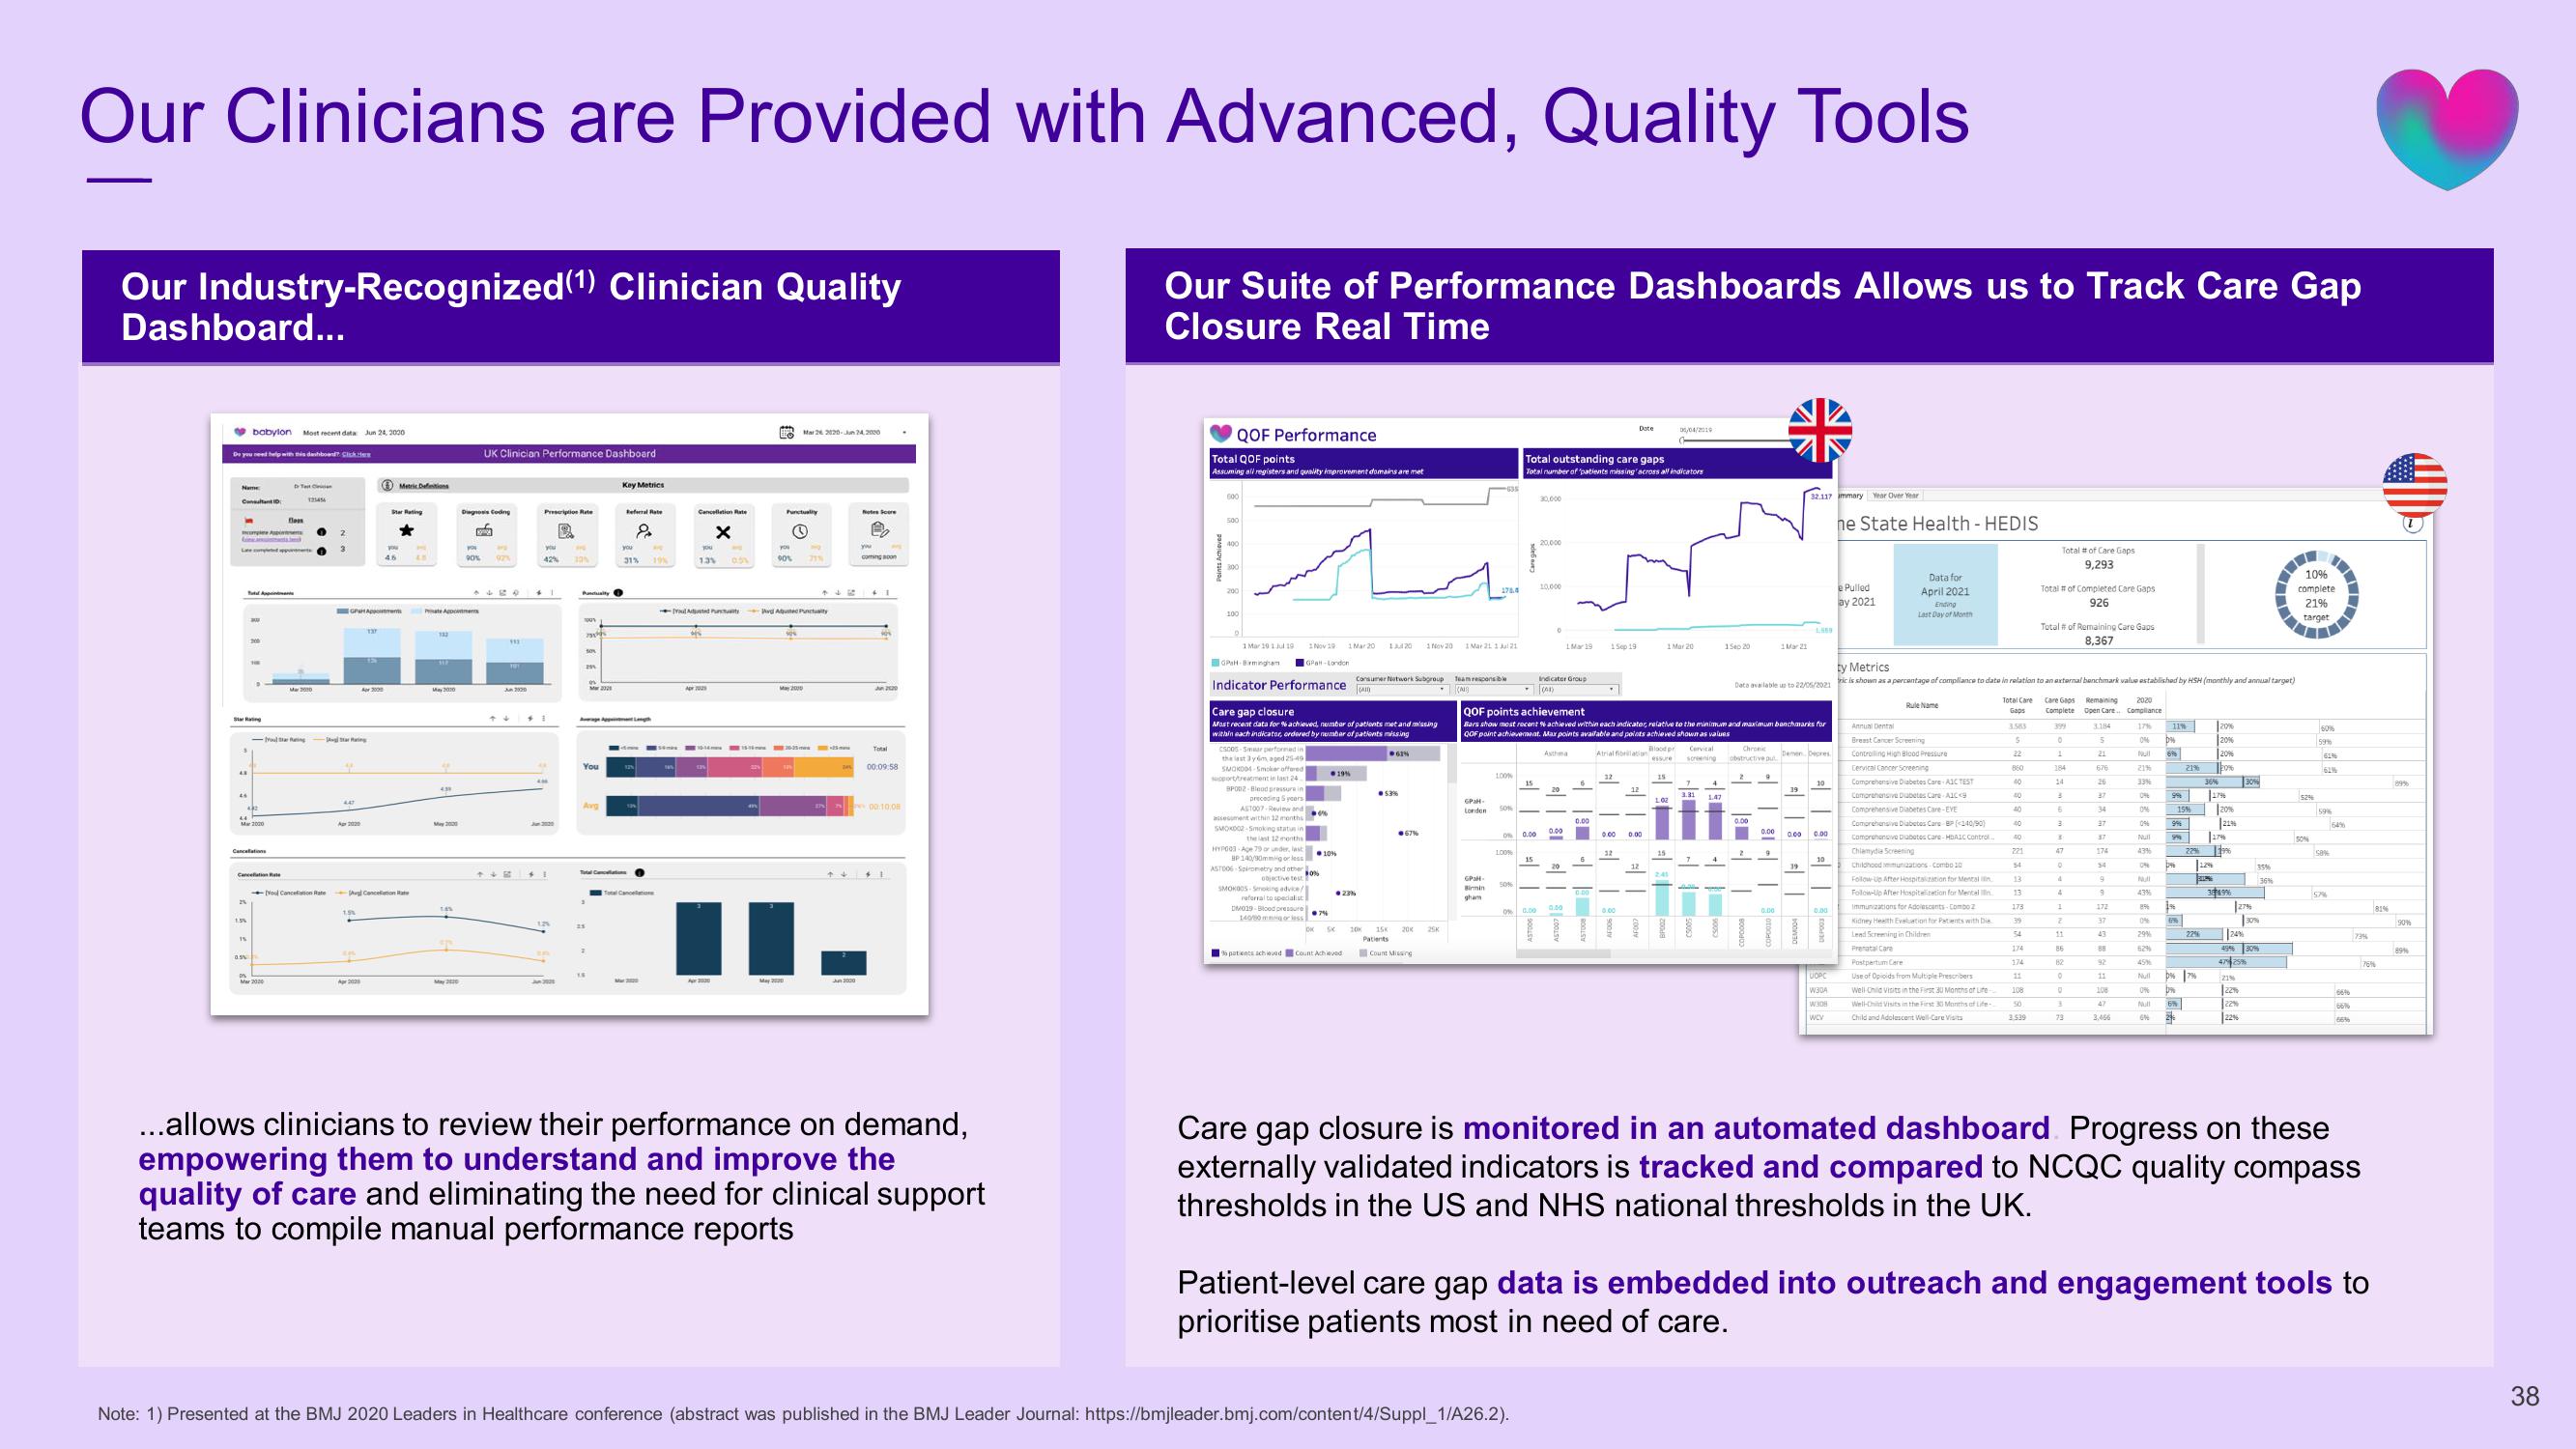
...allows clinicians to review their performance on demand,
empowering them to understand and improve the
quality of care and eliminating the need for clinical support
teams to compile manual performance reports
Our Suite of Performance Dashboards Allows us to Track Care Gap
Closure Real Time
QOF Performance
Total QOF points
Assuming all registers and quality improvement domains are met
600
500
200
100
1 Mar 19 1 Jul 19
GPH-Birmingham
Indicator Performance
GPaH-London
preceding Syears
AST007-Review and
assessment within 12 months
SMOKO02-Smoking status in
the last 12 months
HYP003 Age 79 or under, last
HP 140/90mmHg or less
AST006 Spirometry and other o
objective test
. 10%
Care gap closure
Most recent data for % achieved, number of patients met and missing
within each indicator, ordered by number of patients missing
cs005-Smaar performed in
the last 3y6m aged 25-49
SMOKDO-Smoker offered
support/treatment in last 24
BP002-Bleod pressure in
SMOKOOS-Seoking advice/
referral to specialist
DM019-Blood pressure 7%
140/90 mmHg or less
1 Mar 20 1420
SK
19%
% patients achieved Count Achieved
Consumer Network Subgroup
61%
1 Nov 20
●67%
20K 15K 20K
Patients
Count Missing
1 Mar 21 1 Jul 21
176.4
Team responsibl
GPaH-
London
GPH-
Birmin
gham
100%
50%
0% 0.00
LOON
50%
0%
Total outstanding care gaps
Total number of patients missing across all indicators
15
Note: 1) Presented at the BMJ 2020 Leaders in Healthcare conference (abstract was published in the BMJ Leader Journal: https://bmjleader.bmj.com/content/4/Suppl_1/A26.2).
30.000
0.00
20,000
10,000
QOF points achievement
Bars show most recent % achieved within each indicator, relative to the minimum and maximum banchmarks for
QOF point achievement. Max points available and points achieved shown as values
Atrial fibi
Indicator Group
1 Mar 19
Asthma
0.00
40
1 Sep 19
0.00
al
0.00
32
Date
0.00
AF006
04/04/2019
0.00
1 Mar 20
Blood pr
Cervical
essure screening
3.31
150 20
1.47
Data available up to 22/05/2021
Chronic
obstructive pul
1 Mar 21
www
0.00
32.117 immary Year Over Year
39
10
0.00
10
0.00
W30A
WCV
ne State Health - HEDIS
e Pulled
by 2021
Data for
April 2021
Ending
Last Day of Month
Prenatal Care
Postpartum Cere
Rule Name
Annual Dental
Breast Cancer Screening
Controlling High Blood Pressure
Cervical Cancer Screening
Comprehensive Diabetes Care AIC TEST
Comprehensive Diabetes Care AIC <9
Comprehensive Diabetes Care-EVE
Comprehensive Diabetes Care BP (<140/90)
Comprehensive Diabetes Care-HDAIC Control
Chlamydia Screening
ty Metrics
ric is shown as a percentage of compliance to date in relation to an external benchmark value established by HSH (monthly and annual target)
Childhood immunizations-Combo 10
Follow-Up After Hospitalization for Mental
Follow-Up After Hospitalization for Mental
Immunizations for Adolescents-Comboz
Kidney Health Evaluation for Patients with Die
Lend Screening in Children
Use of Opioids from Multiple Prescribers
Well Child Visits in the First 30 Months of Life
Well-Child Visits in the First 30 Months of Life-
Child and Adolescent Well-Care Visits
Gaps
3.583
22
860
40
40
40
40
221
54
13
13
173
39
54
174
174
11
Total # of Care Gaps
9,293
108
50
3.539
Total # of Completed Care Gaps
926
Total # of Remaining Care Gaps
8,367
Care Gaps
Complete
399
0
184
14
3
47
0
4
A
1
Z
11
86
0
73
Remaining 2020
Open Care.. Compliance
3.184
5
21
676
26
37
34
37
174
54
9
37
43
88
92
11
108
47
3.466
17% 11%
04 D%
21%
33%
1096
096
Null
43%
1046
Null
43%
99
9%
996
0196
896 196
69%
21%
17%
15% 20%
21%
294
36%
29%
62%
45%
Null 0% 7%
0%
6%
22%
BURNE
20%
20%
20%
20%
17%
119%
3849%
24%
27%
21%
30%
22%
22%
22%
35%
49% 30%
30%
36%
52%
50%
60%
59%
61%
61%
59%
58%
57%
64%
66%
66%6
66%
73%
Care gap closure is monitored in an automated dashboard Progress on these
externally validated indicators is tracked and compared to NCQC quality compass
thresholds in the US and NHS national thresholds in the UK.
76%
Patient-level care gap data is embedded into outreach and engagement tools to
prioritise patients most in need of care.
89%
90%
89%
38View entire presentation