JFL Equity Investors VI, L.P Recommendation Report
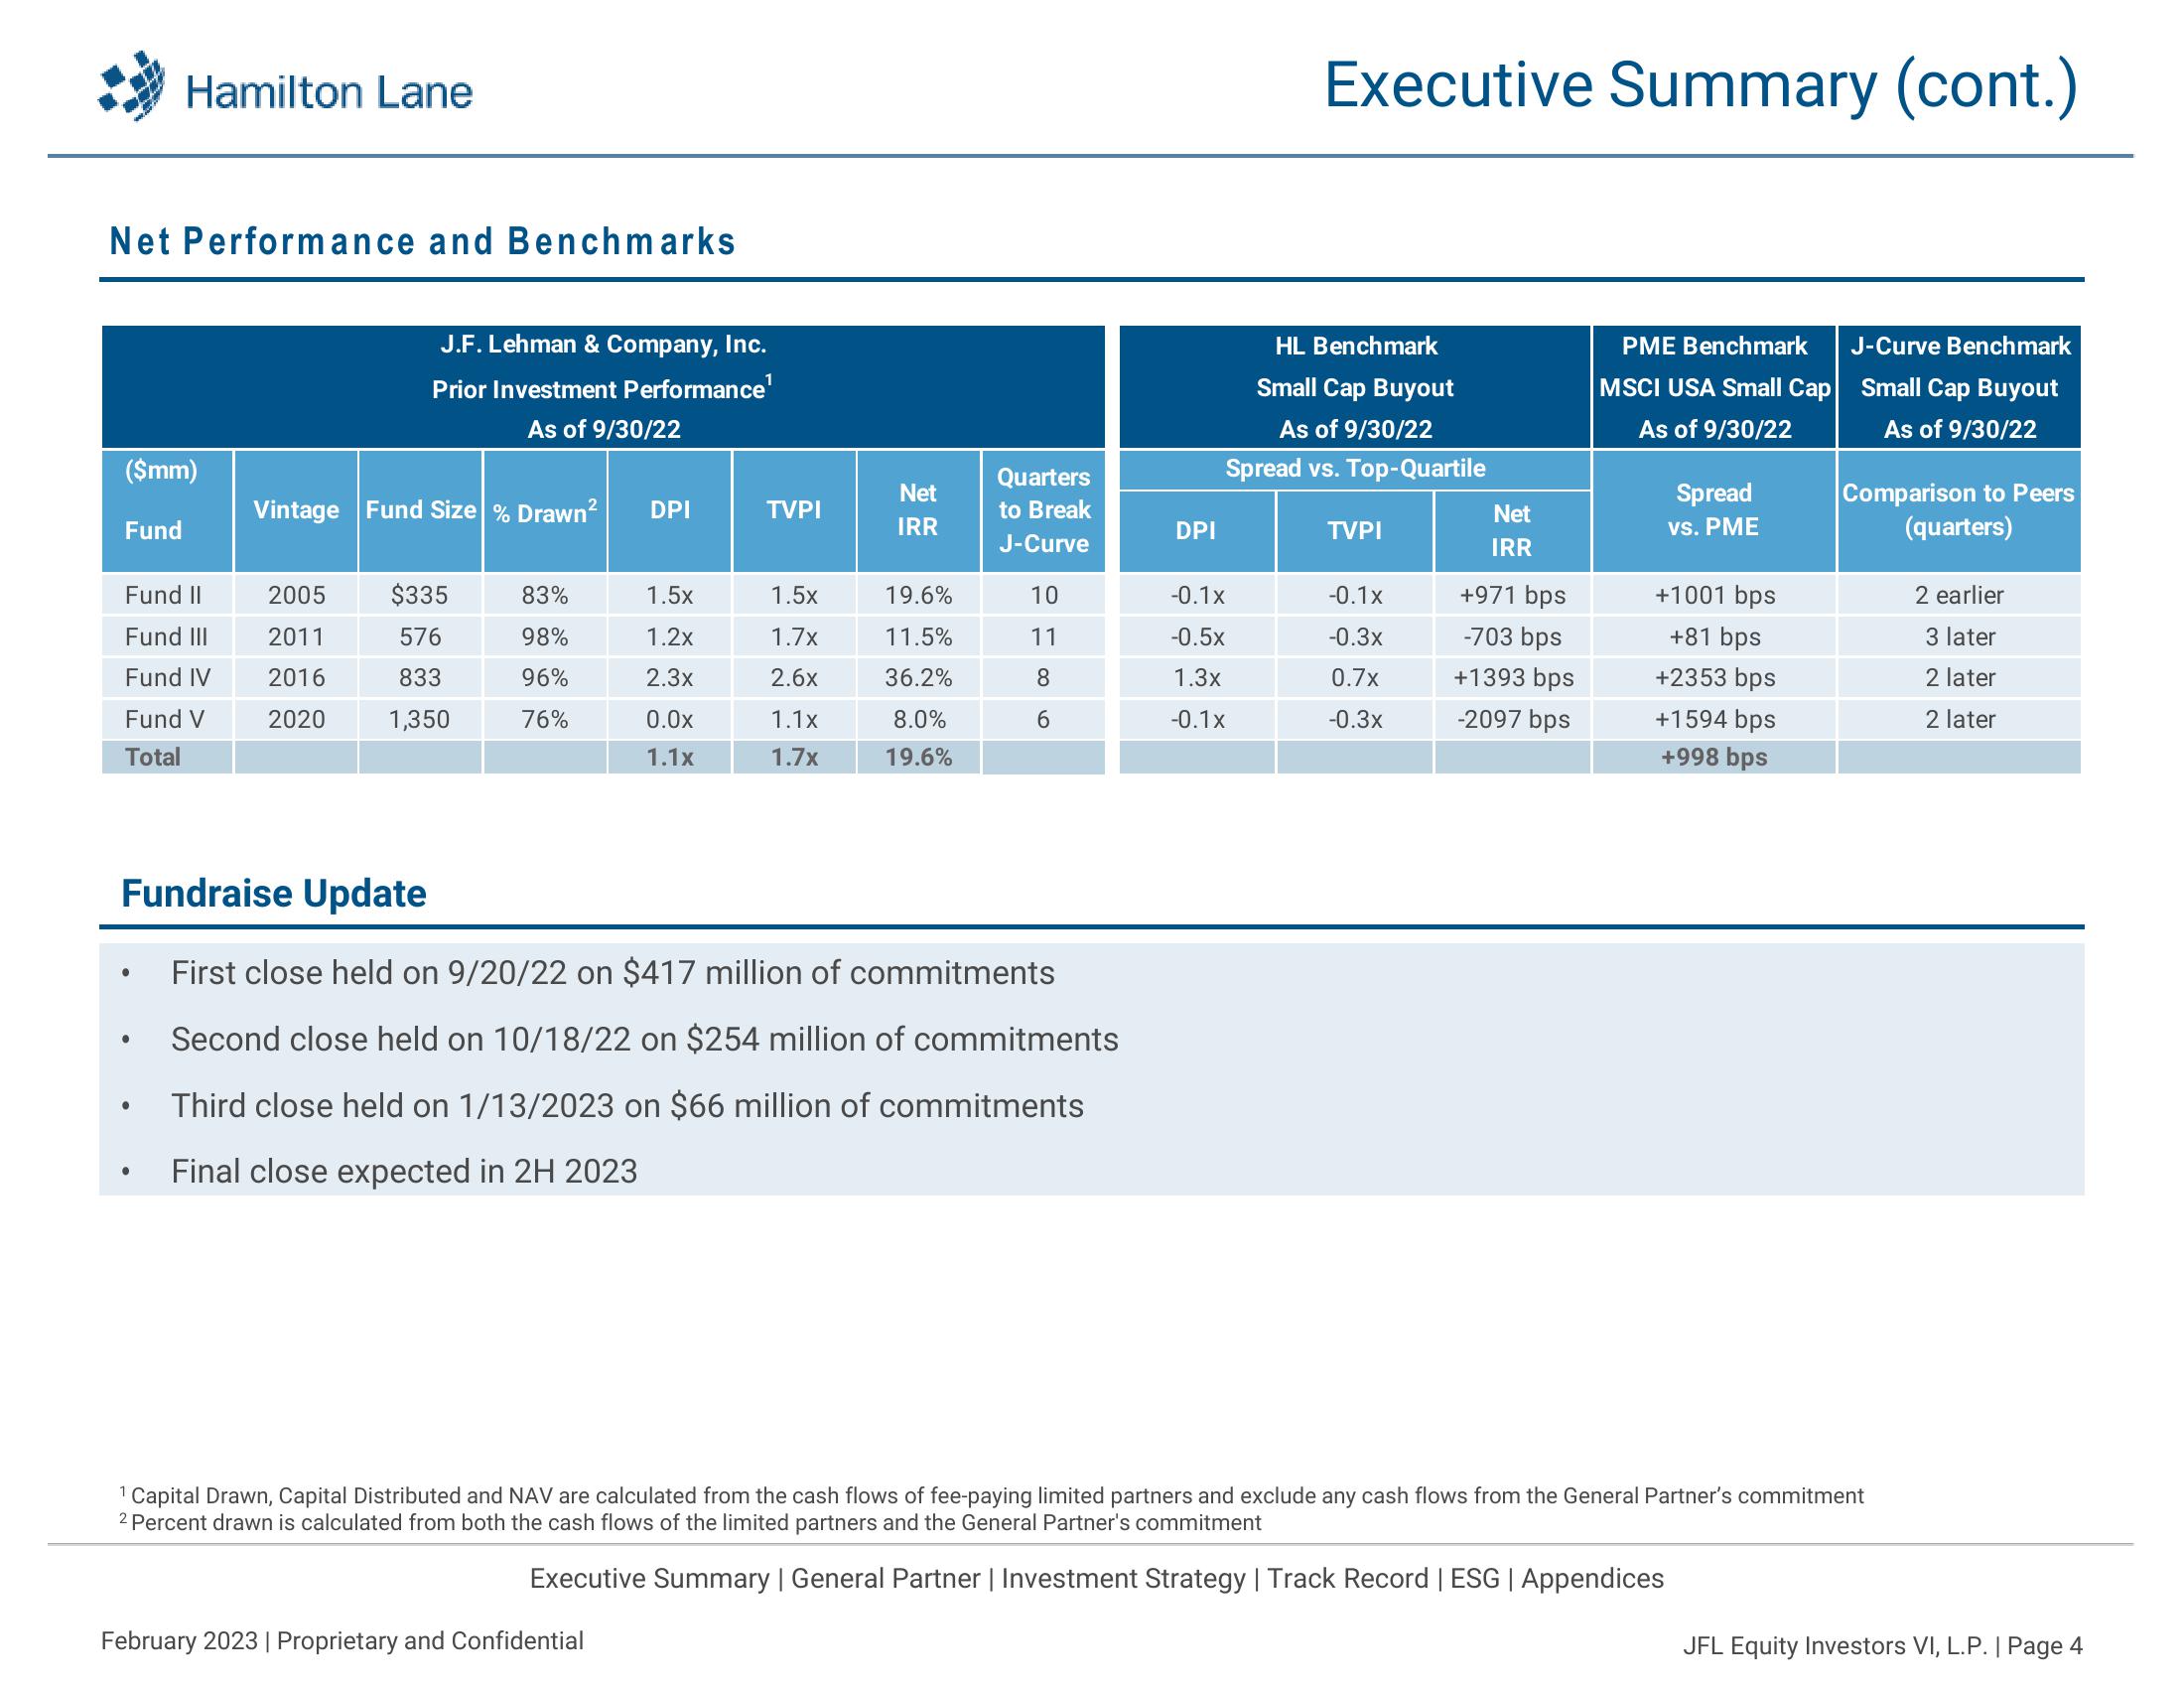
Net Performance and Benchmarks
($mm)
Fund
Hamilton Lane
Fund II
Fund III
Fund IV
Fund V
Total
●
●
●
J.F. Lehman & Company, Inc.
Prior Investment Performance¹
As of 9/30/22
Vintage Fund Size % Drawn²
2005
2011
2016
2020
$335
576
833
1,350
83%
98%
96%
76%
DPI
1.5x
1.2x
2.3x
0.0x
1.1x
TVPI
February 2023 | Proprietary and Confidential
1.5x
1.7x
2.6x
1.1x
1.7x
Net
IRR
Fundraise Update
First close held on 9/20/22 on $417 million of commitments
Second close held on 10/18/22 on $254 million of commitments
Third close held on 1/13/2023 on $66 million of commitments
Final close expected in 2H 2023
19.6%
11.5%
36.2%
8.0%
19.6%
Quarters
to Break
J-Curve
10
11
8
6
DPI
Executive Summary (cont.)
HL Benchmark
Small Cap Buyout
As of 9/30/22
Spread vs. Top-Quartile
-0.1x
-0.5x
1.3x
-0.1x
TVPI
-0.1x
-0.3x
0.7x
-0.3x
Net
IRR
+971 bps
-703 bps
+1393 bps
-2097 bps
PME Benchmark
MSCI USA Small Cap
As of 9/30/22
Spread
vs. PME
+1001 bps
+81 bps
+2353 bps
+1594 bps
+998 bps
Executive Summary | General Partner | Investment Strategy | Track Record | ESG | Appendices
J-Curve Benchmark
Small Cap Buyout
As of 9/30/22
¹ Capital Drawn, Capital Distributed and NAV are calculated from the cash flows of fee-paying limited partners and exclude any cash flows from the General Partner's commitment
2 Percent drawn is calculated from both the cash flows of the limited partners and the General Partner's commitment
Comparison to Peers
(quarters)
2 earlier
3 later
2 later
2 later
JFL Equity Investors VI, L.P. | Page 4View entire presentation