System1 Investor Presentation Deck
23
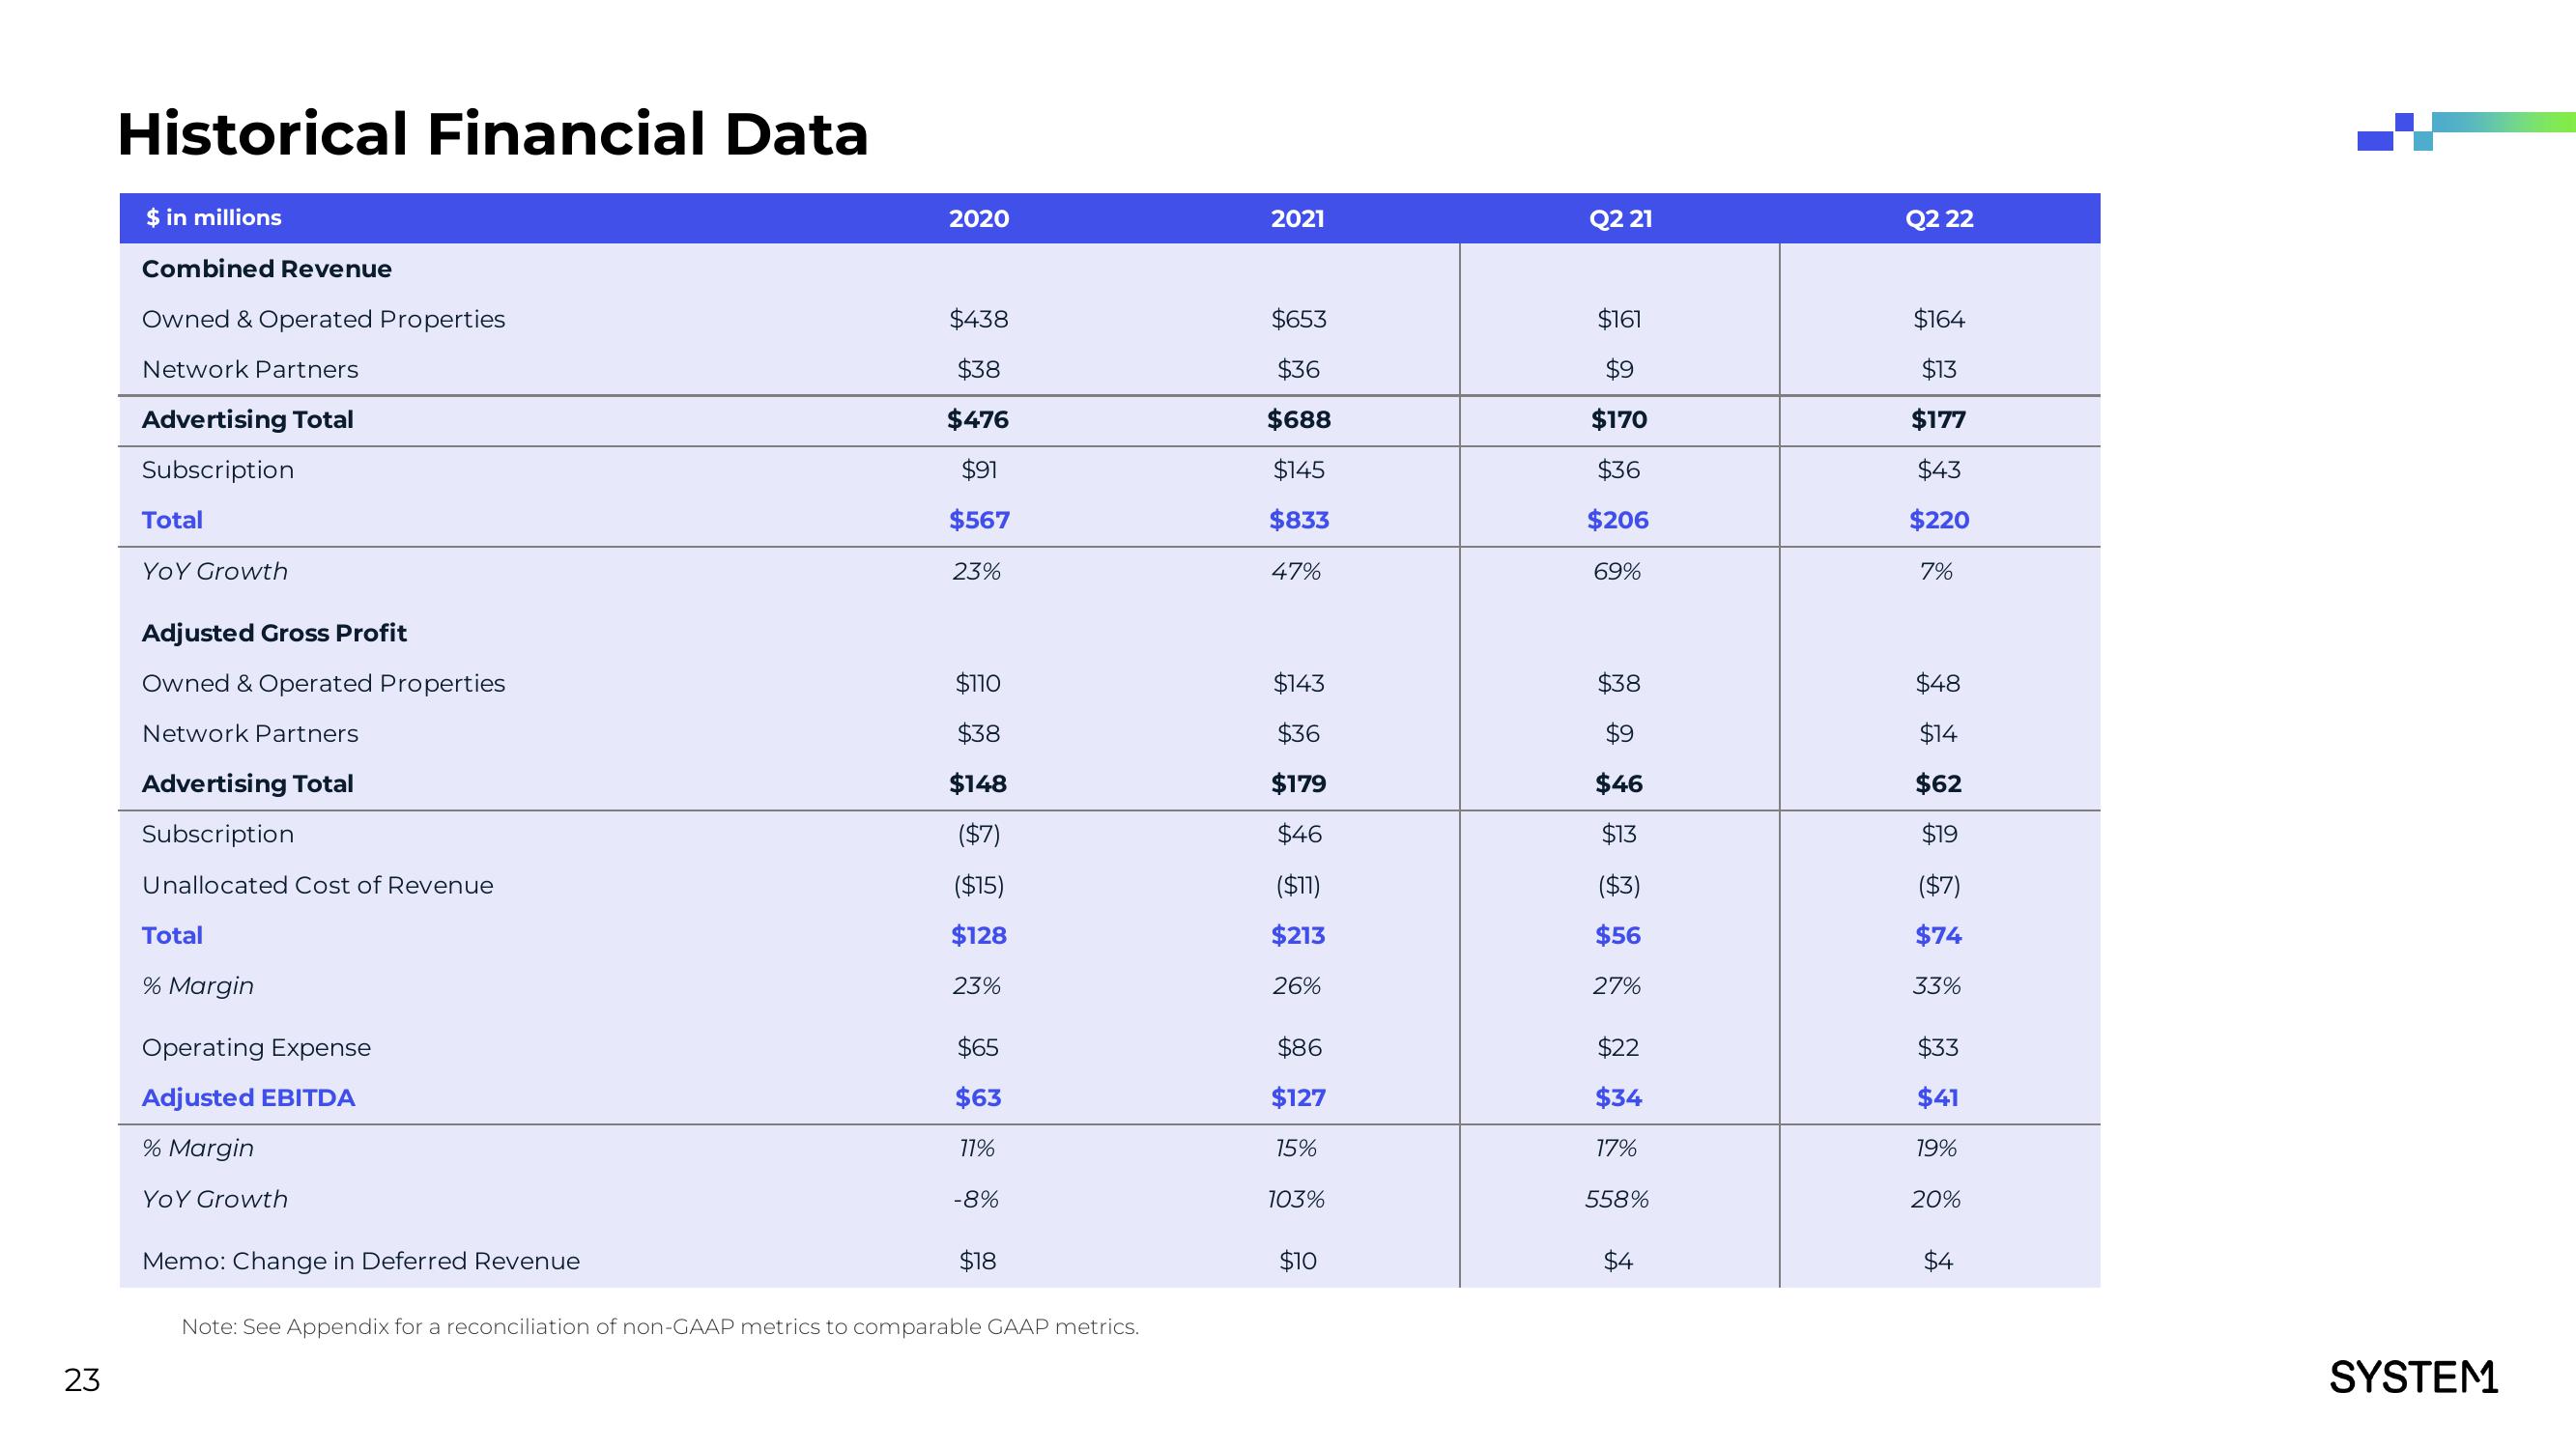
Historical Financial Data
$ in millions
Combined Revenue
Owned & Operated Properties
Network Partners
Advertising Total
Subscription
Total
YOY Growth
Adjusted Gross Profit
Owned & Operated Properties
Network Partners
Advertising Total
Subscription
Unallocated Cost of Revenue
Total
% Margin
Operating Expense
Adjusted EBITDA
% Margin
YOY Growth
Memo: Change in Deferred Revenue
2020
$438
$38
$476
$91
$567
23%
$110
$38
$148
($7)
($15)
$128
23%
$65
$63
11%
-8%
$18
Note: See Appendix for a reconciliation of non-GAAP metrics to comparable GAAP metrics.
2021
$653
$36
$688
$145
$833
47%
$143
$36
$179
$46
($11)
$213
26%
$86
$127
15%
103%
$10
Q2 21
$161
$9
$170
$36
$206
69%
$38
$9
$46
$13
($3)
$56
27%
$22
$34
17%
558%
$4
Q2 22
$164
$13
$177
$43
$220
7%
$48
$14
$62
$19
($7)
$74
33%
$33
$41
19%
20%
$4
SYSTEMView entire presentation