Clover Health SPAC Presentation Deck
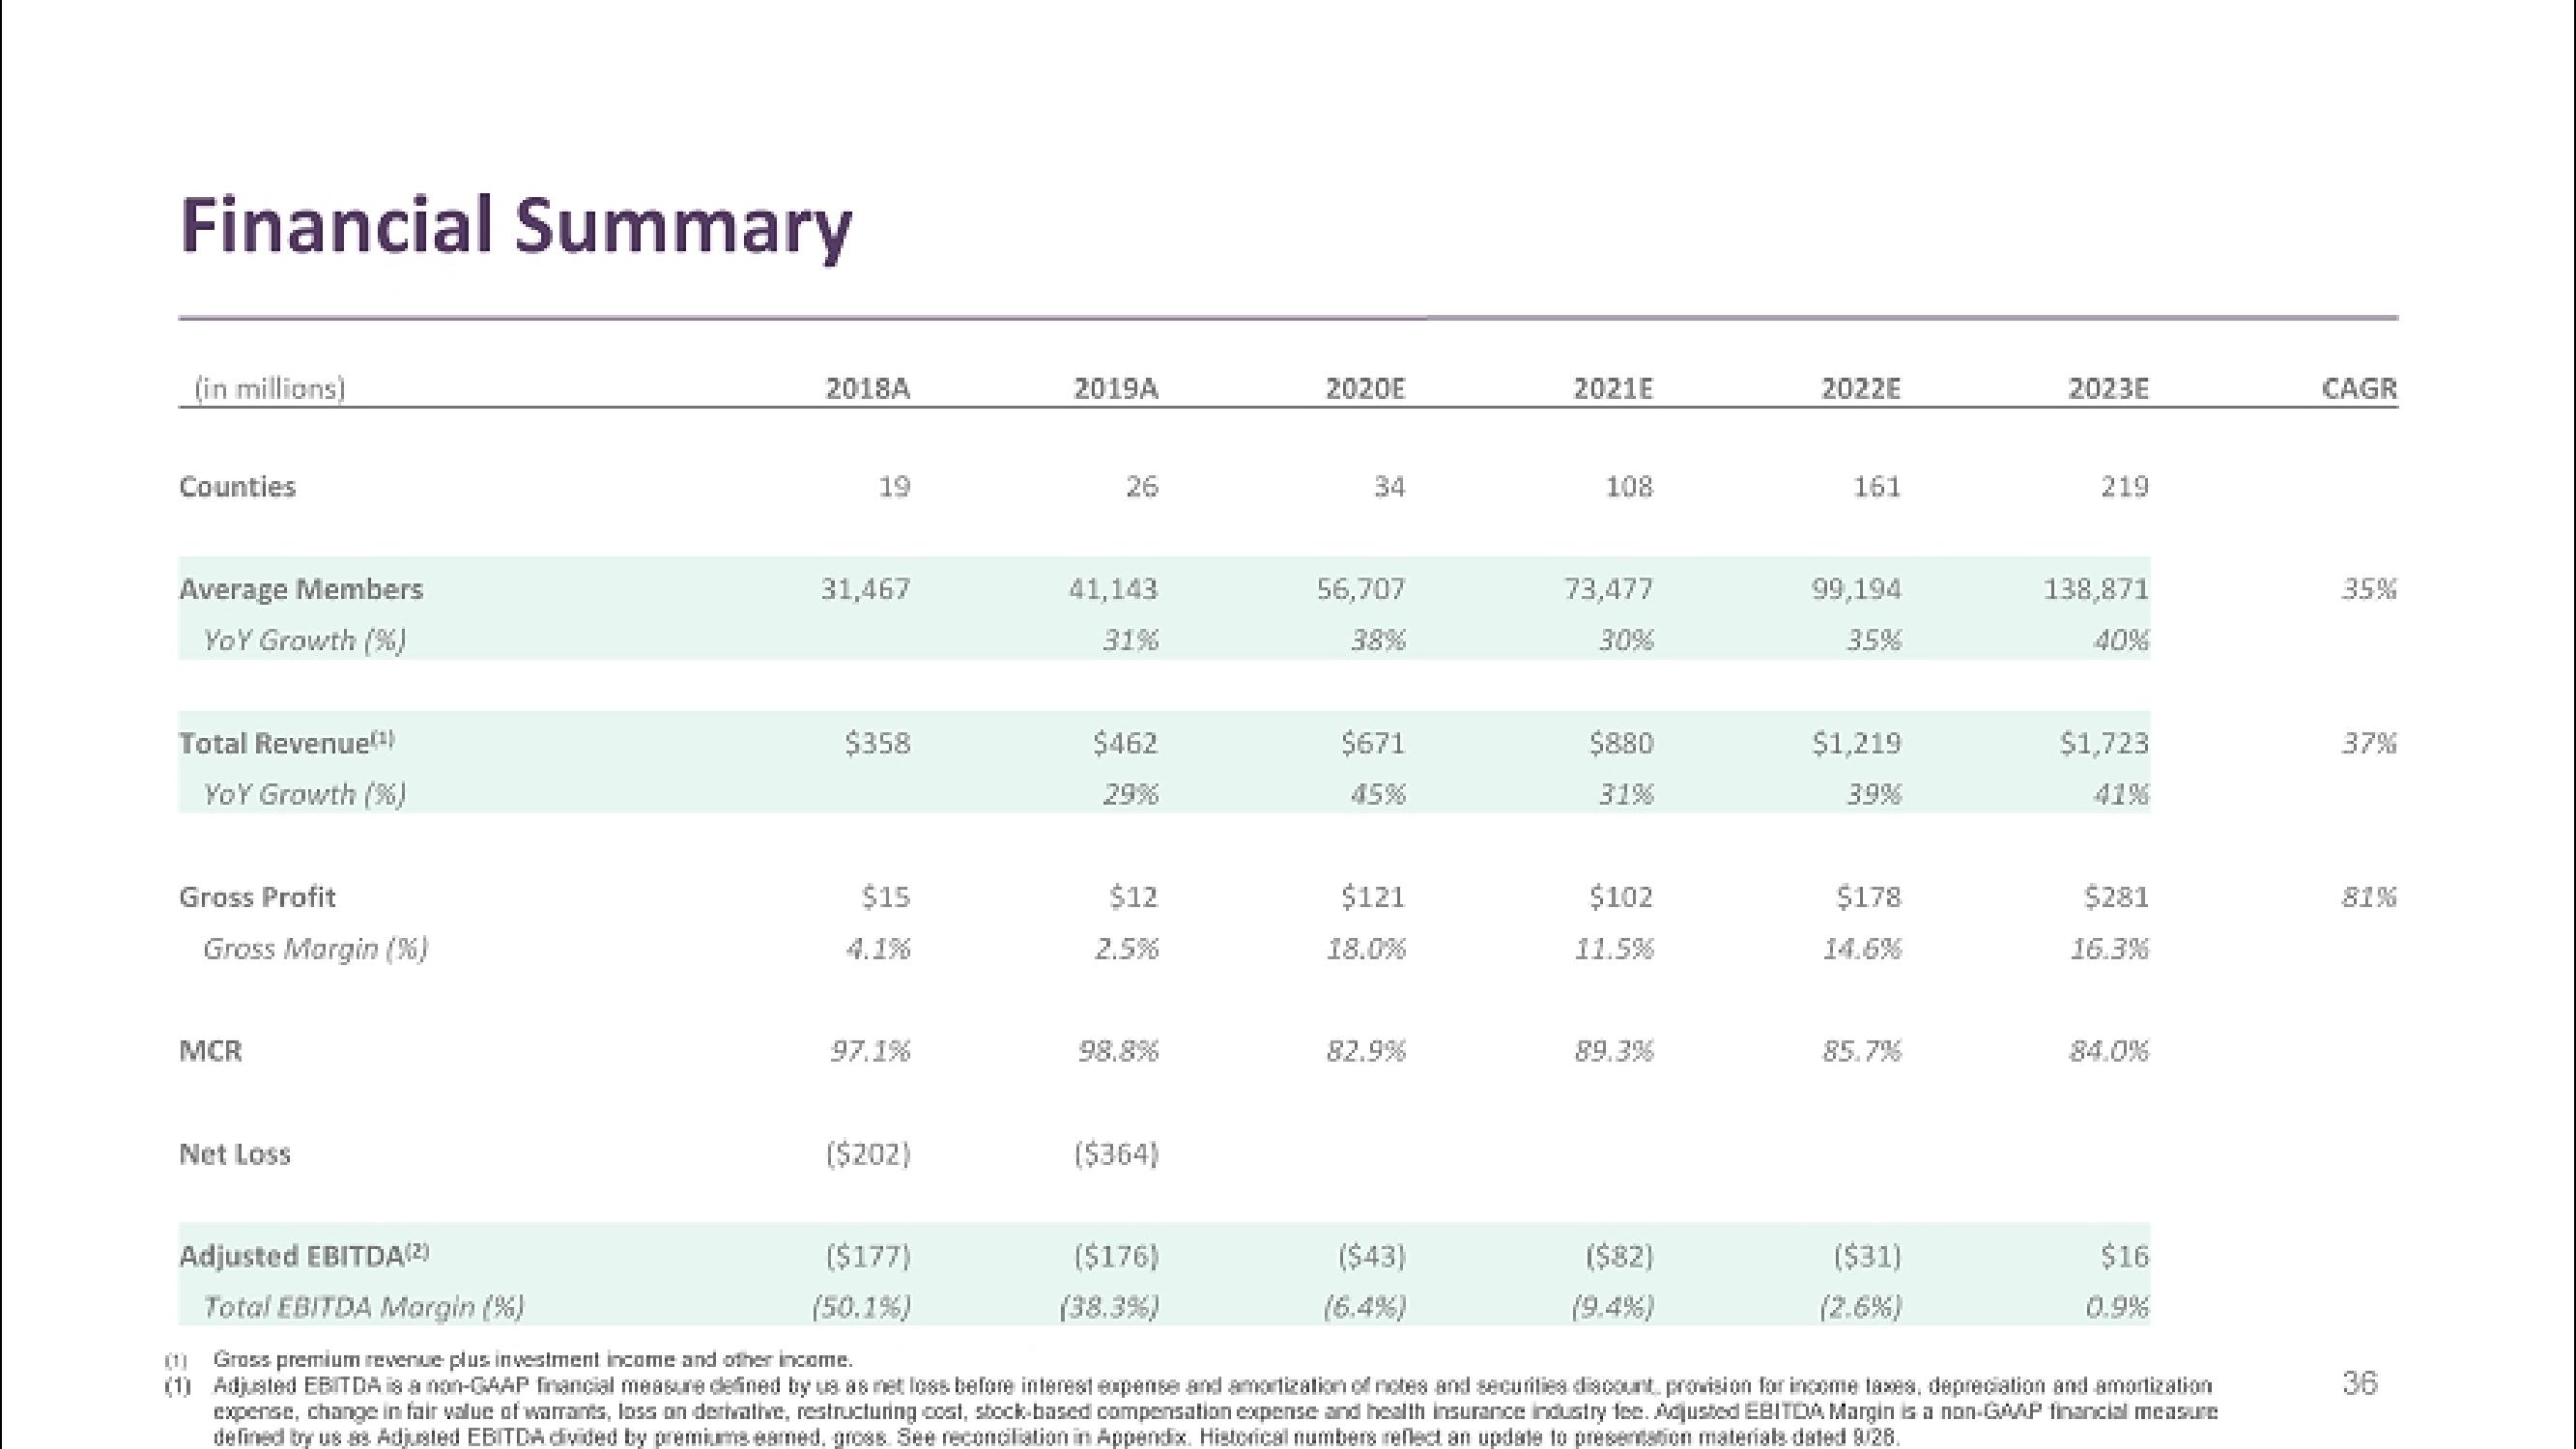
Financial Summary
(in millions)
Counties
Average Members
YOY Growth (%)
Total Revenue(¹)
YOY Growth (%)
Gross Profit
Gross Margin (%)
MCR
Net Loss
Adjusted EBITDA (2)
Total EBITDA Margin (%)
2018A
19
31,467
$358
$15
97.1%
($202)
($177)
(50.1%)
2019A
41,143
31%
$462
29%
$12
($364)
($176)
2020E
34
56,707
$671
$121
18.0%
82.9%
($43)
2021E
108
73,477
30%
$880
31%
$102
11.5%
89.3%
($82)
(9.4%)
2022E
161
99,194
35%
$1,219
39%
$178
($31)
2023E
219
138,871
40%
$1,723
41%
$281
16.3%
$16
0.9%
(01)
Gross premium revenue plus investment income and other income.
(1) Adjusted EBITDA is a non-GAAP financial measure defined by us as net loss before interest expense and amortization of notes and securities discount, provision for income taxes, depreciation and amortization
expense, change in fair value of warrants, loss on derivative, restructuring cost, stock-based compensation expense and health insurance industry fee. Adjusted EBITDA Margin is a non-GAAP financial measure
defined by us as Adjusted EBITDA divided by premiums esmed, gross. See reconciliation in Appendix. Historical numbers reflect an update to presentation materials dated 9/28.
CAGR
35%
37%
81%
36View entire presentation