Solid Power SPAC Presentation Deck
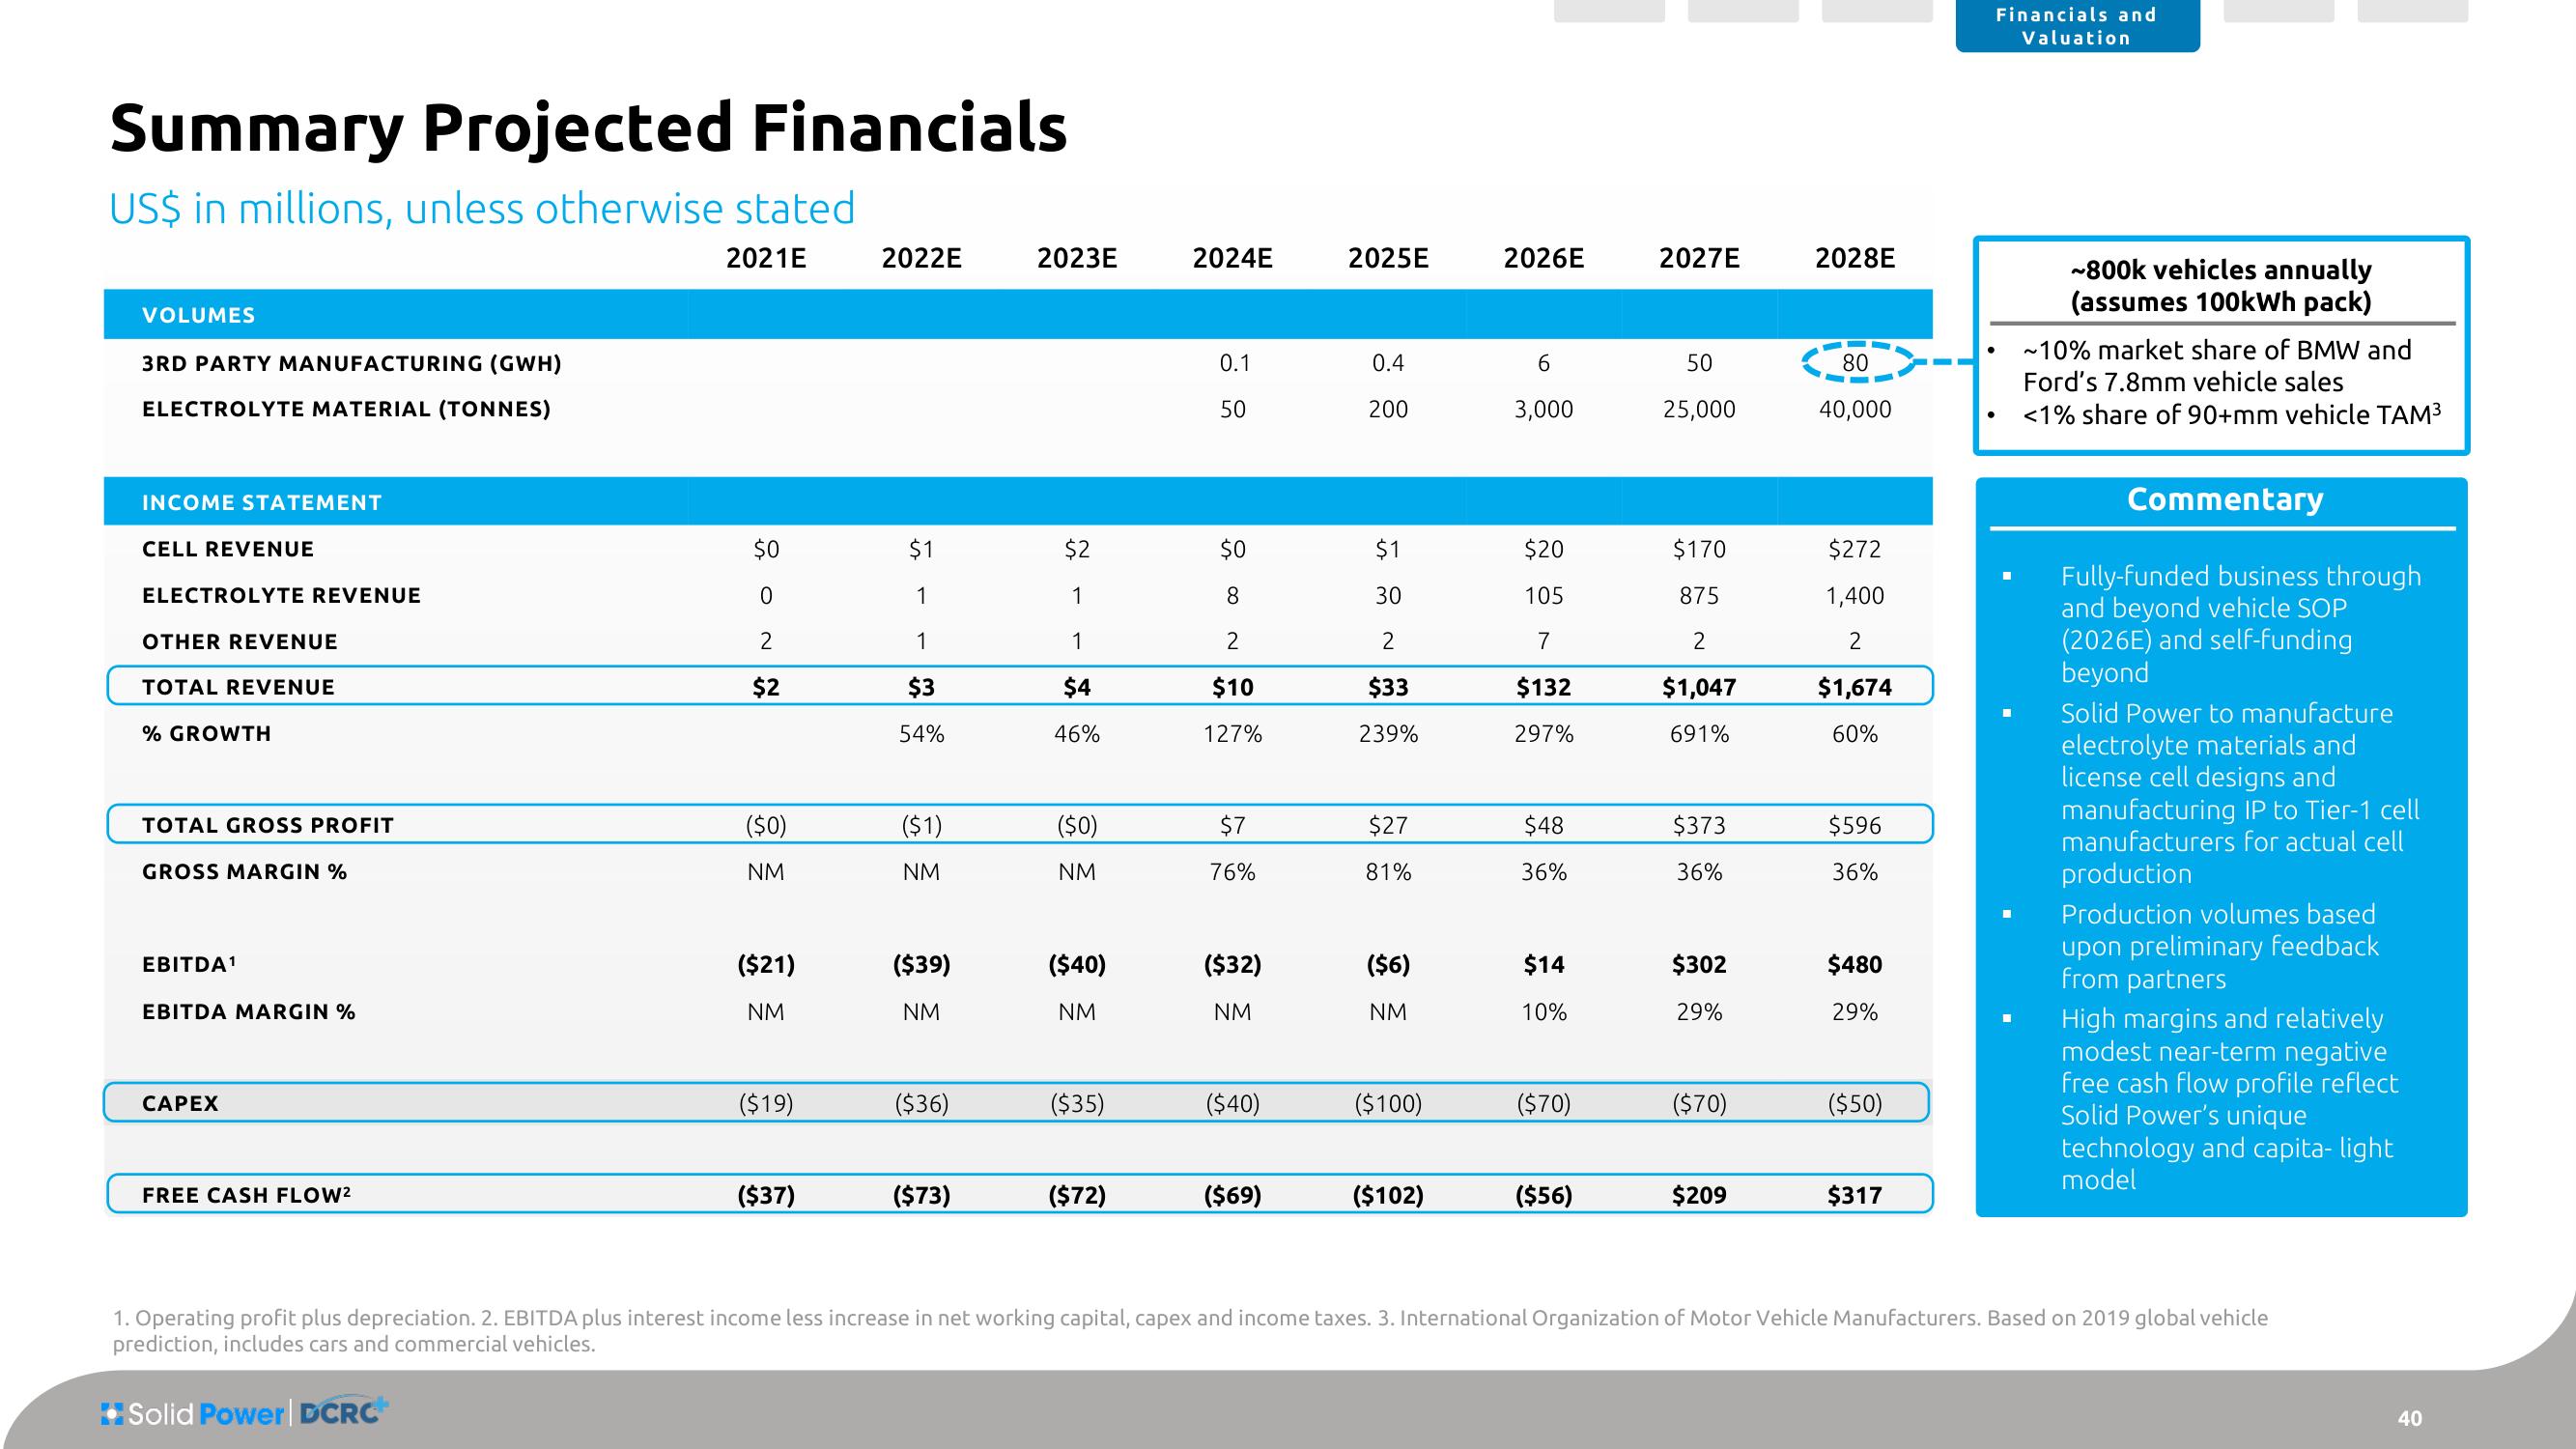
Summary Projected Financials
US$ in millions, unless otherwise stated
2021E
VOLUMES
3RD PARTY MANUFACTURING (GWH)
ELECTROLYTE MATERIAL (TONNES)
INCOME STATEMENT
CELL REVENUE
ELECTROLYTE REVENUE
OTHER REVENUE
TOTAL REVENUE
% GROWTH
TOTAL GROSS PROFIT
GROSS MARGIN %
EBITDA¹
EBITDA MARGIN %
CAPEX
FREE CASH FLOW²
$0
0
2
$2
($0)
NM
($21)
NM
($19)
($37)
2022E
$1
1
1
$3
54%
($1)
NM
($39)
NM
($36)
($73)
2023E
$2
1
1
$4
46%
($0)
NM
($40)
NM
($35)
($72)
2024E
0.1
50
0 8
$0
2
$10
127%
$7
76%
($32)
NM
($40)
($69)
2025E
0.4
200
$1
30
2
$33
239%
$27
81%
($6)
NM
($100)
($102)
2026E
6
3,000
$20
105
7
$132
297%
$48
36%
$14
10%
($70)
($56)
2027E
50
25,000
$170
875
2
$1,047
691%
$373
36%
$302
29%
($70)
$209
2028E
80
40,000
$272
1,400
2
$1,674
60%
$596
36%
$480
29%
($50)
$317
Financials and
Valuation
●
~800k vehicles annually
(assumes 100kWh pack)
~10% market share of BMW and
Ford's 7.8mm vehicle sales
<1% share of 90+mm vehicle TAM³
Commentary
Fully-funded business through
and beyond vehicle SOP
(2026E) and self-funding
beyond
Solid Power to manufacture
electrolyte materials and
license cell designs and
manufacturing IP to Tier-1 cell
manufacturers for actual cell
production
Production volumes based
upon preliminary feedback
from partners
High margins and relatively
modest near-term negative
free cash flow profile reflect
Solid Power's unique
technology and capita- light
model
1. Operating profit plus depreciation. 2. EBITDA plus interest income less increase in net working capital, capex and income taxes. 3. International Organization of Motor Vehicle Manufacturers. Based on 2019 global vehicle
prediction, includes cars and commercial vehicles.
Solid Power | DCRC
40View entire presentation