Astra SPAC Presentation Deck
FINANCIAL SUMMARY WITH KEY DRIVERS
($ in Millions)
# of Launches
Total Launch Revenue
# of Satellites Launched
Modular Spacecraft Platform Revenue
# of Spaceports Deployed
Spaceport Services Revenue
Total Revenue
% Revenue Growth
Gross Profit(1)
% Gross Margin(1)
Adj. EBITDA(1)
% Adj. EBITDA Margin
(-) A Working Capital
(-) CapEx
Unlevered Free Cash Flow
Source: Management estimates.
(1) Before stock-based compensation.
2021E
3
$4
($6)
NM
($81)
NM
$3
($96)
($175)
2022E
15
$47
10
$6
1
$15
$67
1,697%
$14
20%
($130)
NM
$1
($25)
($154)
2023E
55
$206
60
$31
1
$18
$256
280%
$119
46%
($53)
NM
($1)
($61)
($116)
2024E
165
$619
250
$123
2
$38
$780
205%
$477
61%
$238
31%
($2)
($60)
$177
PROPRIETARY & CONFIDENTIAL - DO NOT REDISTRIBUTE
2025E
300
$1,125
660
$314
3
$62
$1,501
92%
$1,045
70%
$694
46%
$5
($24)
$676
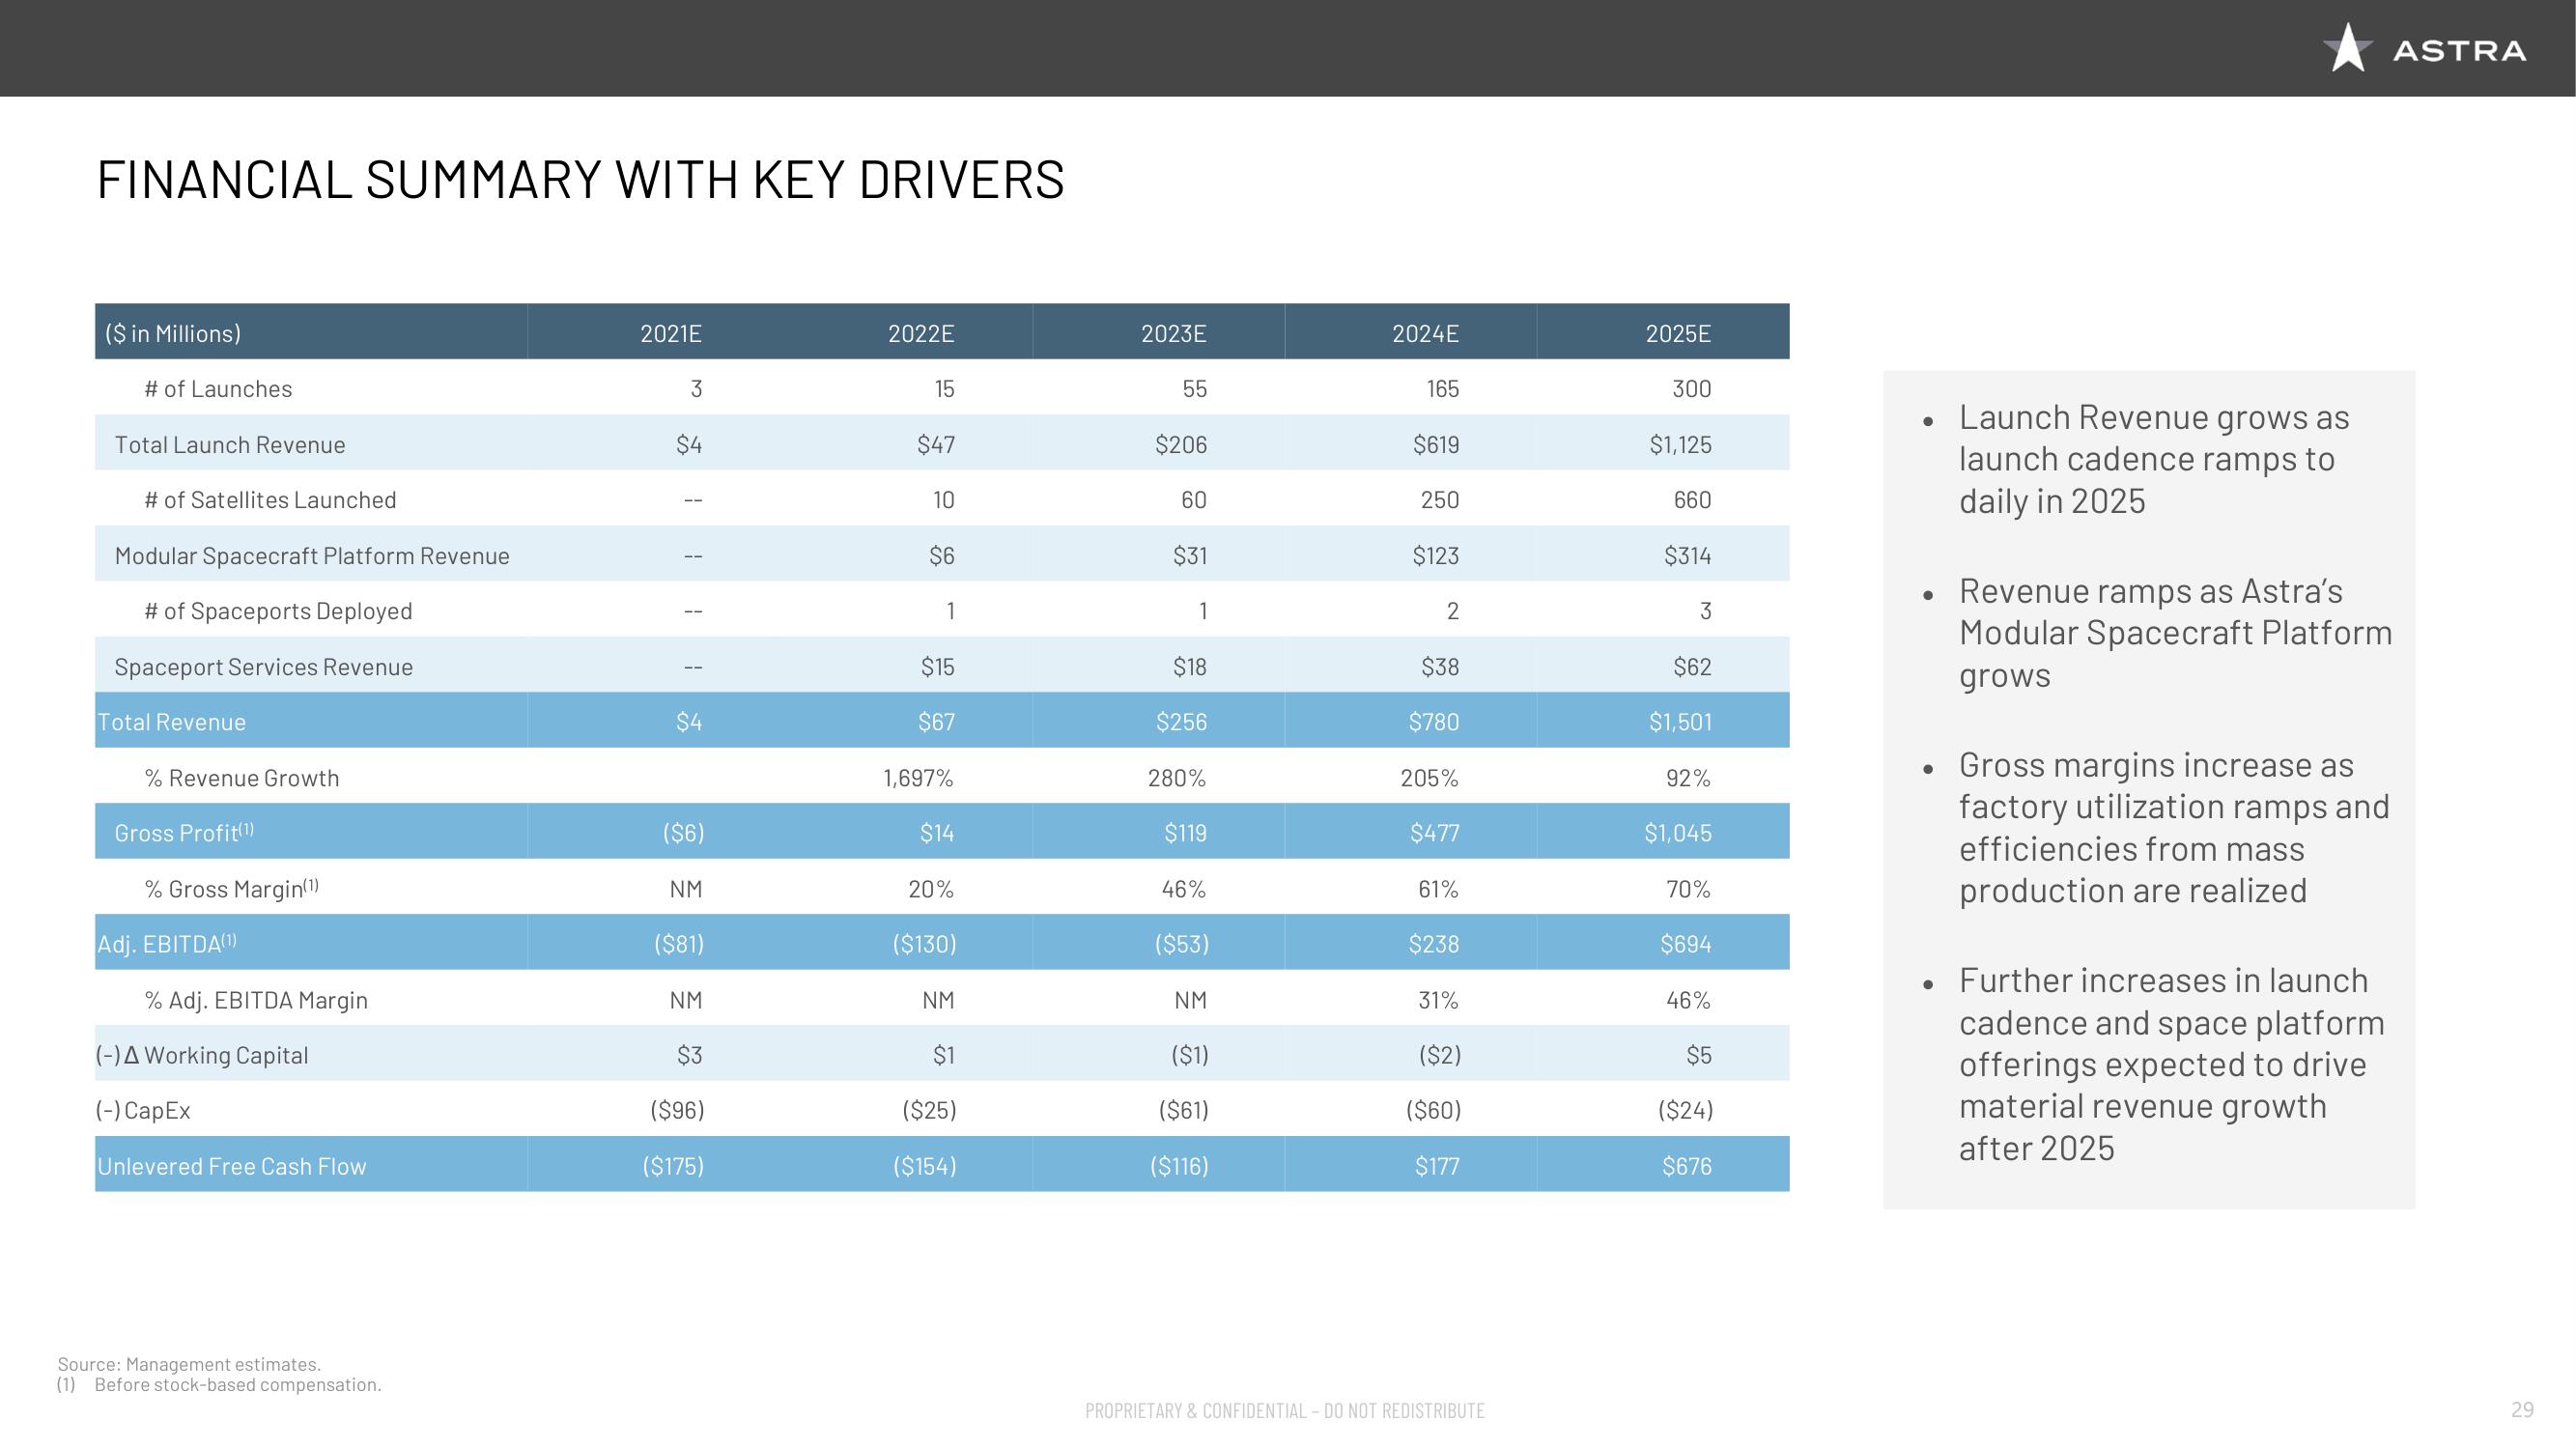
• Launch Revenue grows as
launch cadence ramps to
daily in 2025
●
●
●
Revenue ramps as Astra's
Modular Spacecraft Platform
grows
Gross margins increase as
factory utilization ramps and
efficiencies from mass
production are realized
Further increases in launch
cadence and space platform
offerings expected to drive
material revenue growth
after 2025
ASTRA
29View entire presentation