Matterport Results Presentation Deck
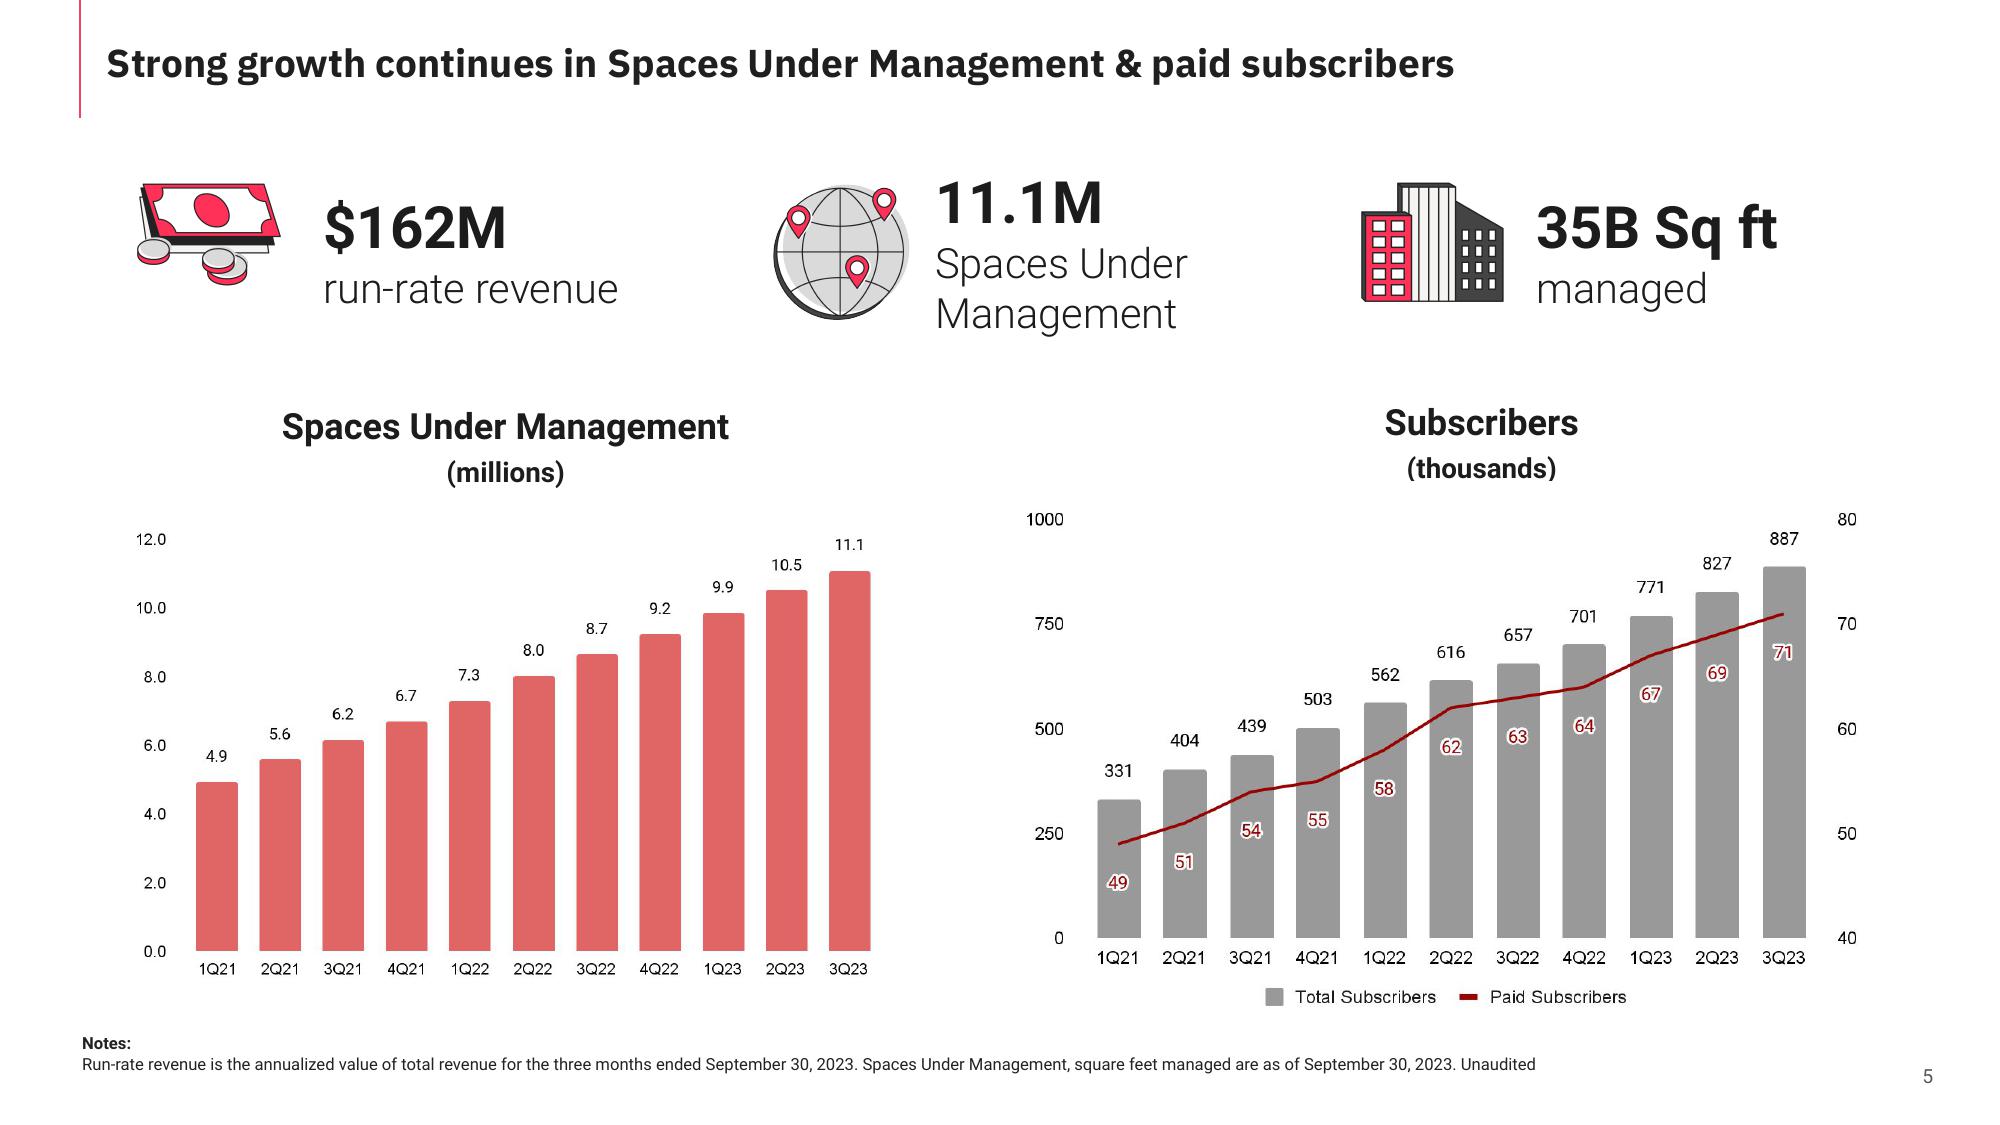
Strong growth continues in Spaces Under Management & paid subscribers
12.0
10.0
8.0
6.0
4.0
2.0
0.0
4.9
$162M
run-rate revenue
Spaces Under Management
(millions)
5.6
6.2
6.7
7.3
8.0
8.7
9.2
9.9
10.5
11.1
1Q21 2Q21 3Q21 4Q21 1Q22 2Q22 3Q22 4Q22 1Q23 2Q23 3Q23
11.1M
Spaces Under
Management
1000
750
500
250
0
331
404
54
H|
51
439
49
1Q21 2Q21 3Q21
503
55
Subscribers
(thousands)
562
58
616
35B Sq ft
managed
657
701
63
62
64
III
4Q21 1Q22 2Q22 3Q22 4Q22
Notes:
Run-rate revenue is the annualized value of total revenue for the three months ended September 30, 2023. Spaces Under Management, square feet managed are as of September 30, 2023. Unaudited
Total Subscribers -Paid Subscribers
771
67
827
887
71
1Q23 2Q23 3Q23
80
70
60
50
40
5View entire presentation