Melrose Results Presentation Deck
Structures: results
£m
Melrose
Revenue
EBITDA
EBITDA margin %
Operating profit
Operating margin %
Driver
Explanation
H1 2023 progress
Adjusted ¹
results
H1 2023
1.
2.
1,025
72
7.0%
26
Path to 9% target margin in 2025
2.5%
Growth vs
H1 2022
18% 2
2.8ppts
92%
1
3.6ppts
n/a
■
I
■
·
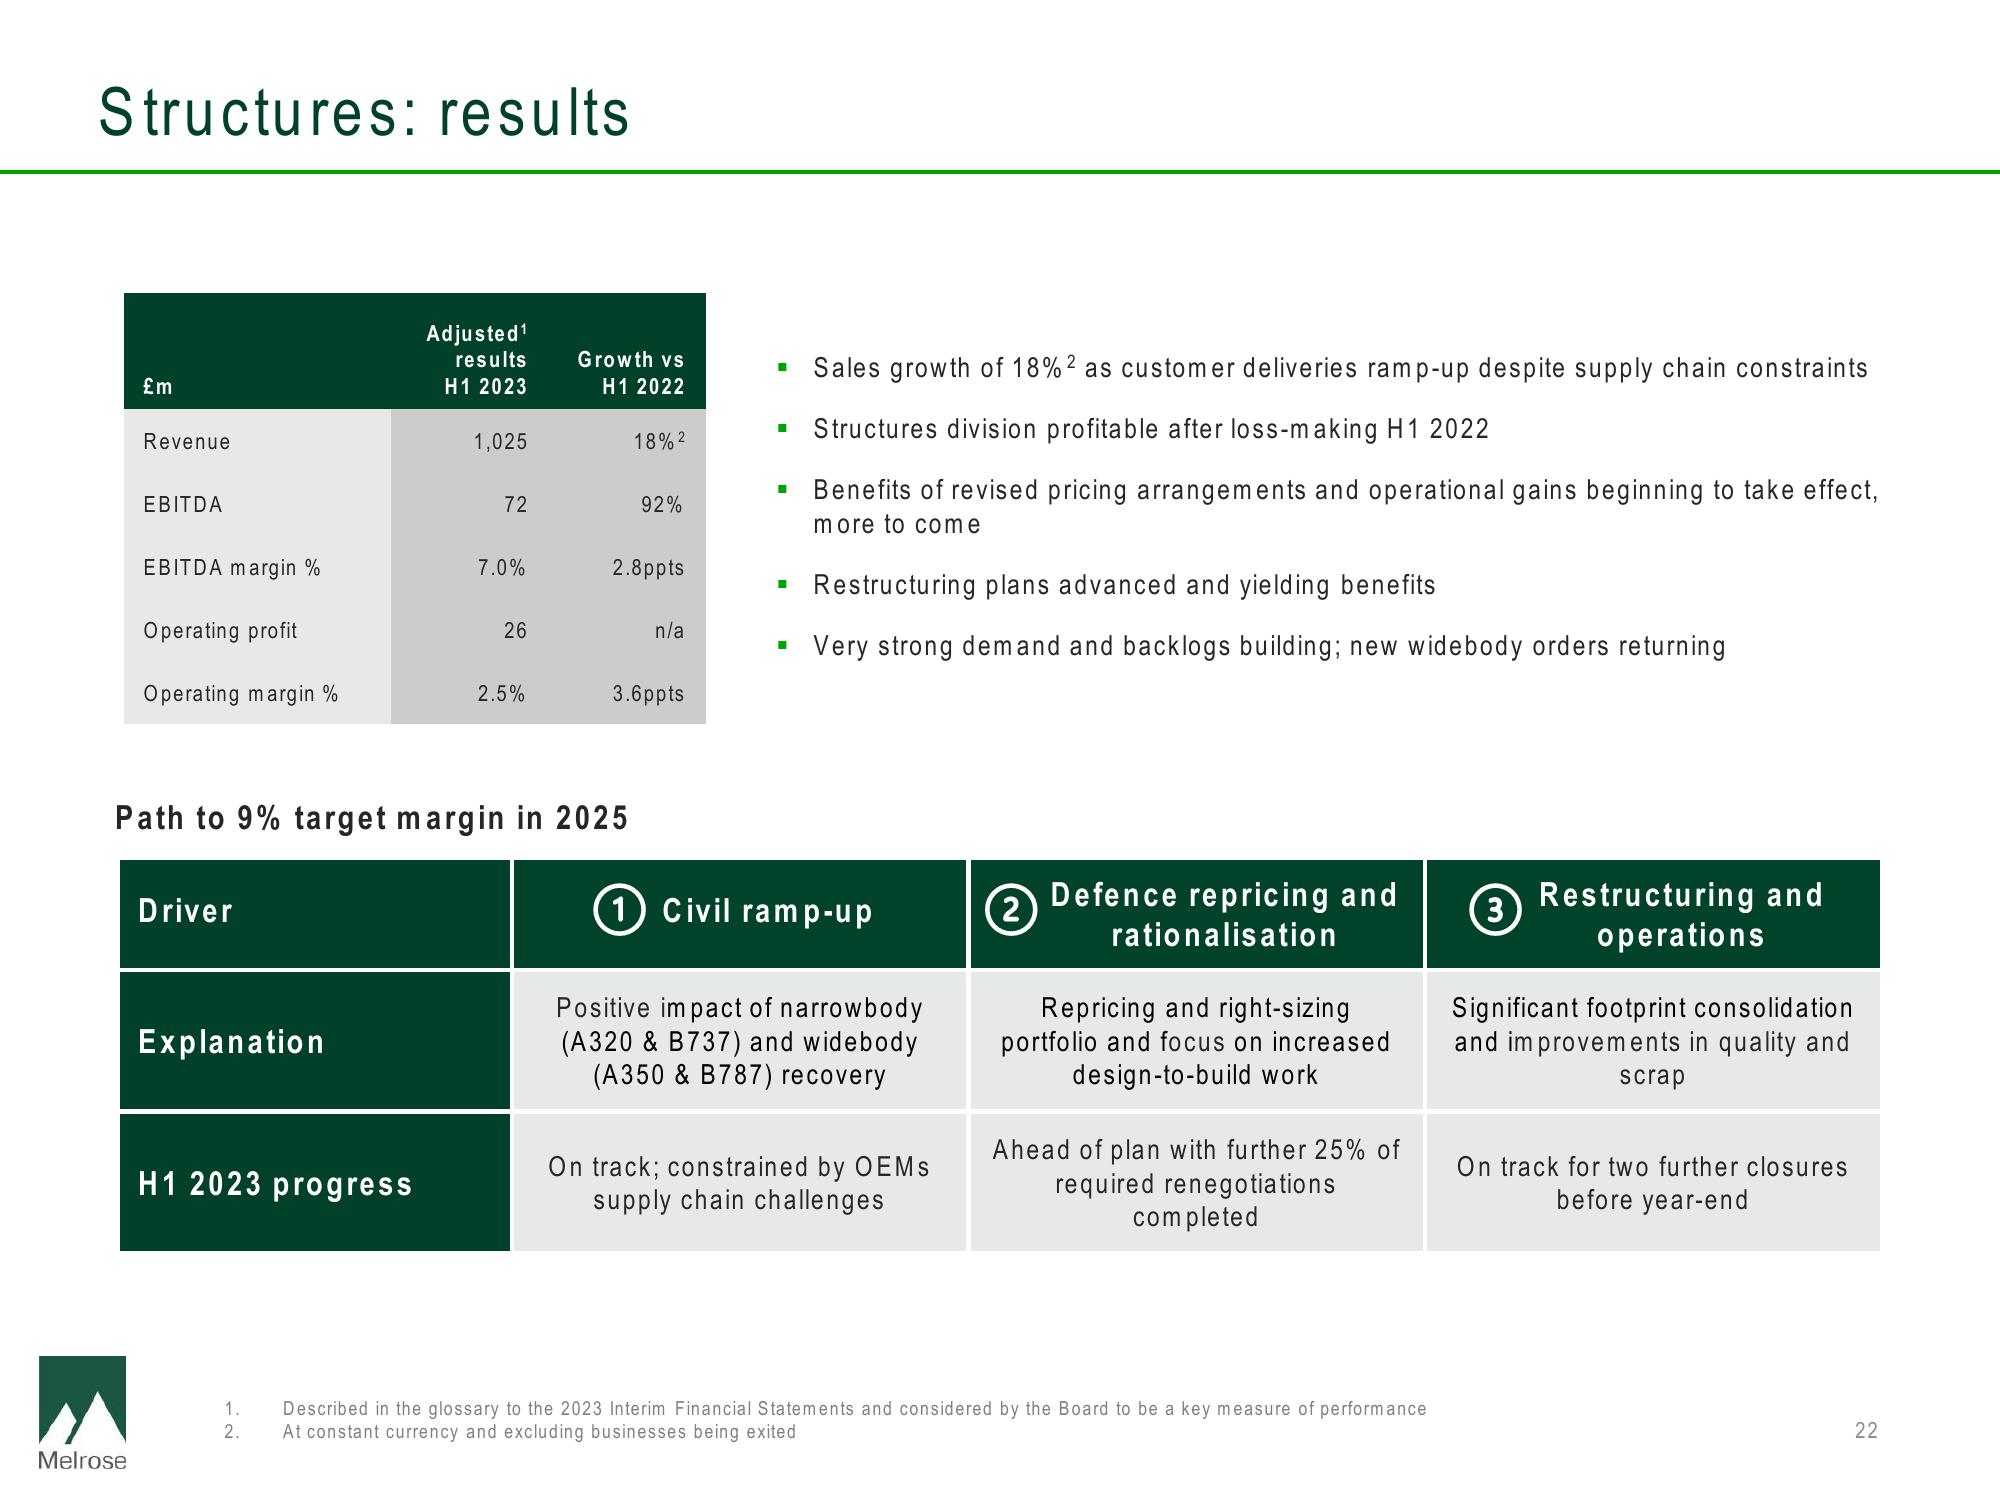
Sales growth of 18%2 as customer deliveries ramp-up despite supply chain constraints
Structures division profitable after loss-making H1 2022
Benefits of revised pricing arrangements and operational gains beginning to take effect,
more to come
Restructuring plans advanced and yielding benefits
Very strong demand and backlogs building; new widebody orders returning
Civil ramp-up
Positive impact of narrowbody
(A320 & B737) and widebody
(A350 & B787) recovery
On track; constrained by OEMs
supply chain challenges
(2)
Defence repricing and
rationalisation
Repricing and right-sizing
portfolio and focus on increased
design-to-build work
Ahead of plan with further 25% of
required renegotiations
completed
Described in the glossary to the 2023 Interim Financial Statements and considered by the Board to be a key measure of performance
At constant currency and excluding businesses being exited
3
Restructuring and
operations
Significant footprint consolidation
and improvements in quality and
scrap
On track for two further closures
before year-end
22View entire presentation