Silicon Valley Bank Results Presentation Deck
Non-GAAP reconciliation
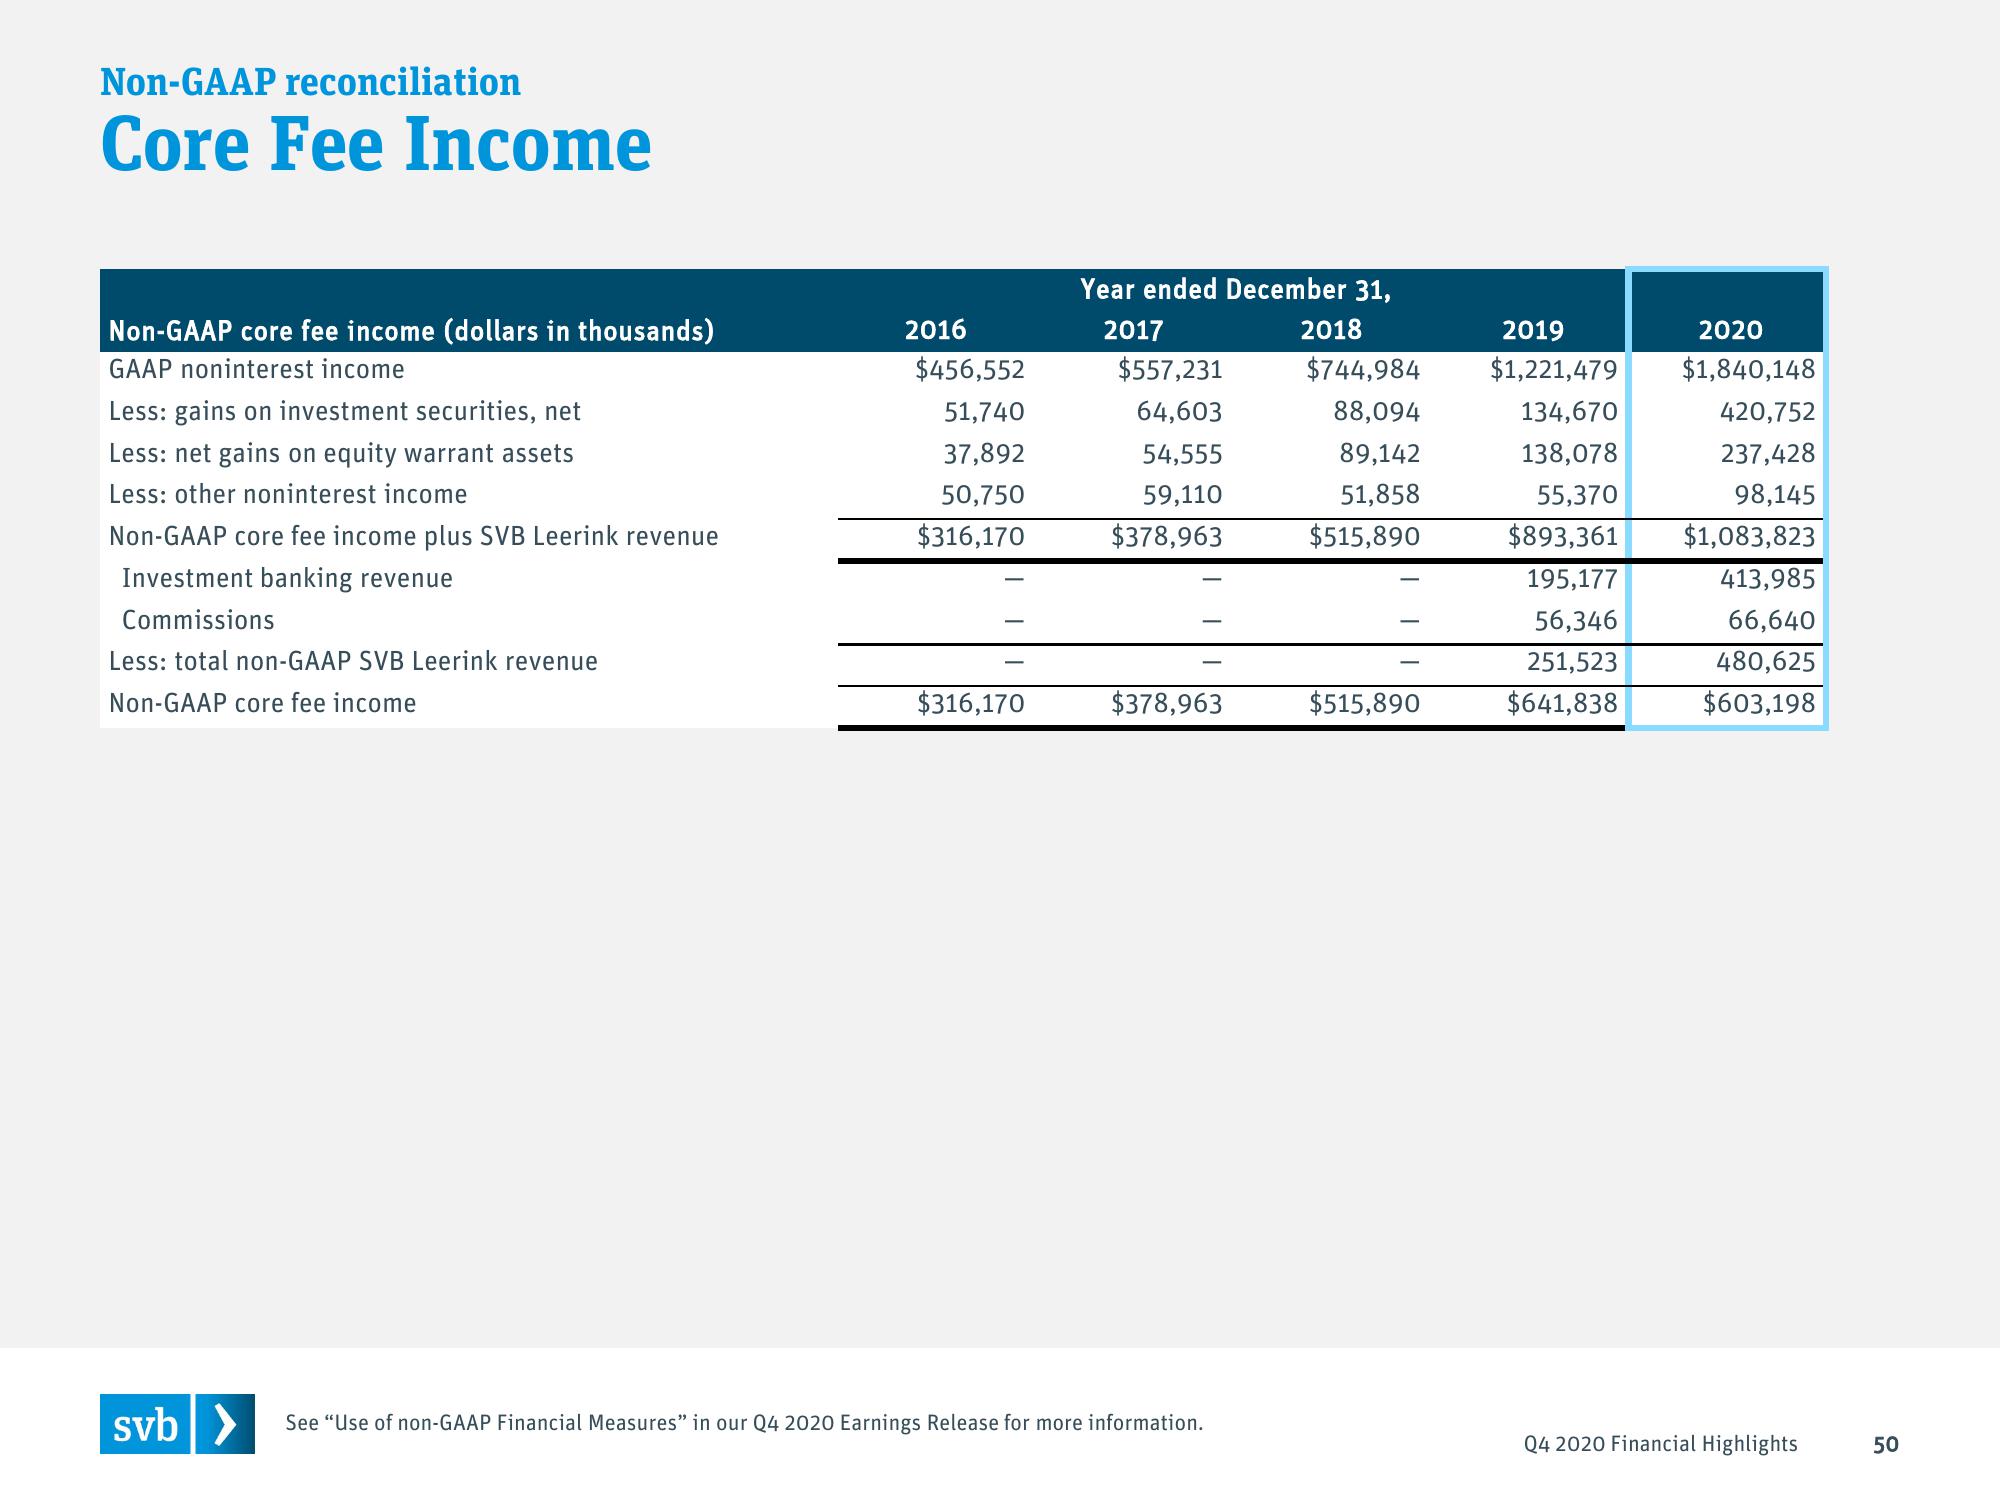
Core Fee Income
Non-GAAP core fee income (dollars in thousands)
GAAP noninterest income
Less: gains on investment securities, net
Less: net gains on equity warrant assets
Less: other noninterest income
Non-GAAP core fee income plus SVB Leerink revenue
Investment banking revenue
Commissions
Less: total non-GAAP SVB Leerink revenue
Non-GAAP core fee income
2016
$456,552
51,740
37,892
50,750
$316,170
$316,170
Year ended December 31,
2017
$557,231
64,603
54,555
59,110
$378,963
$378,963
svb > See "Use of non-GAAP Financial Measures" in our Q4 2020 Earnings Release for more information.
2018
$744,984
88,094
89,142
51,858
$515,890
$515,890
2019
$1,221,479
134,670
138,078
55,370
$893,361
195,177
56,346
251,523
$641,838
2020
$1,840,148
420,752
237,428
98,145
$1,083,823
413,985
66,640
480,625
$603,198
Q4 2020 Financial Highlights
50View entire presentation