Bank of America Investment Banking Pitch Book
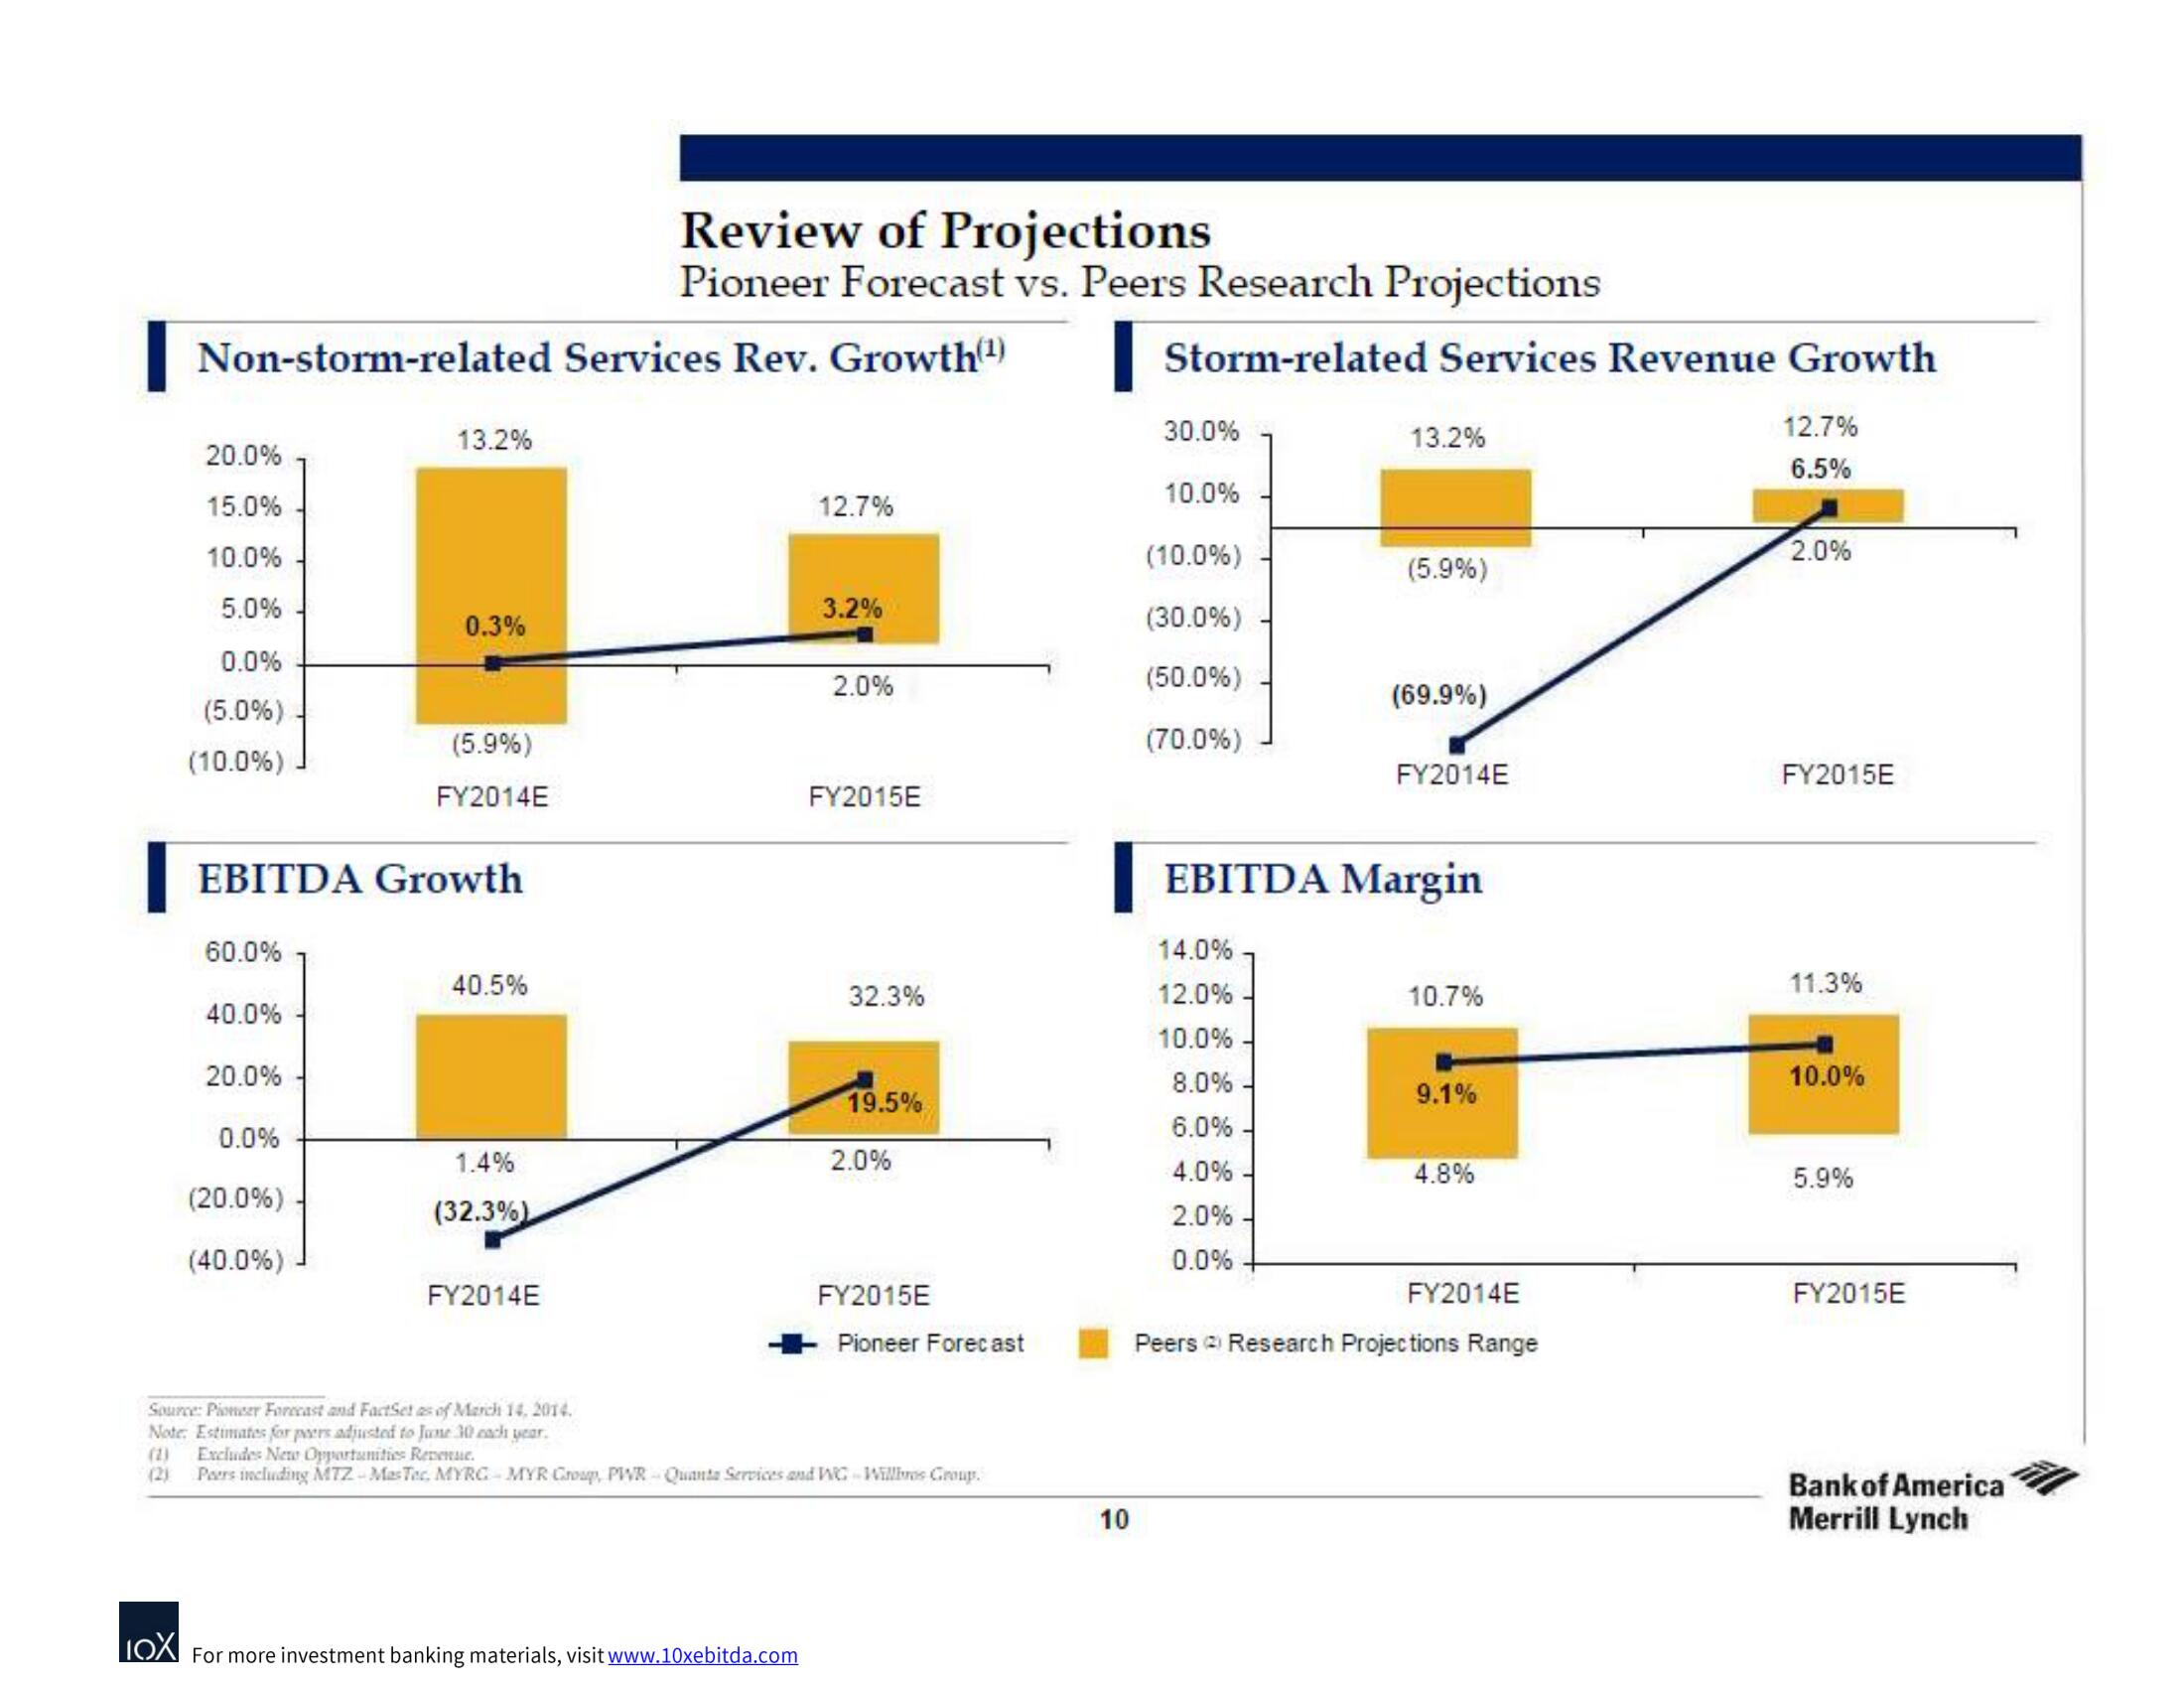
| Non-storm-related Services Rev. Growth(¹)
20.0%
15.0%
10.0%
5.0%
0.0%
(5.0%)
(10.0%)
60.0%
40.0%
20.0%
EBITDA Growth
0.0%
13.2%
(20.0%)
(40.0%)
0.3%
(5.9%)
FY2014E
40.5%
1.4%
(32.3%)
Review of Projections
Pioneer Forecast vs. Peers Research Projections
FY2014E
12.7%
LOX For more investment banking materials, visit www.10xebitda.com
3.2%
2.0%
FY2015E
32.3%
19.5%
2.0%
FY2015E
Pioneer Forecast
Source: Pioneer Forecast and FactSet as of March 14, 2014.
Note: Estimates for peers adjusted to June 30 each year.
Excludes New Opportunities Revenue.
(2) Peers including MTZ-MasTec, MYRC MYR Group, PWR Quanta Services and WG Willbros Group.
10
Storm-related Services Revenue Growth
30.0%
10.0%
(10.0%)
(30.0%)
(50.0%)
(70.0%)
13.2%
14.0%
12.0%
10.0%
8.0%
6.0%
4.0%
2.0%
0.0%
(5.9%)
(69.9%)
FY2014E
EBITDA Margin
10.7%
9.1%
4.8%
FY2014E
Peers Research Projections Range
12.7%
6.5%
2.0%
FY2015E
11.3%
10.0%
5.9%
FY2015E
Bank of America
Merrill LynchView entire presentation