Tuya Results Presentation Deck
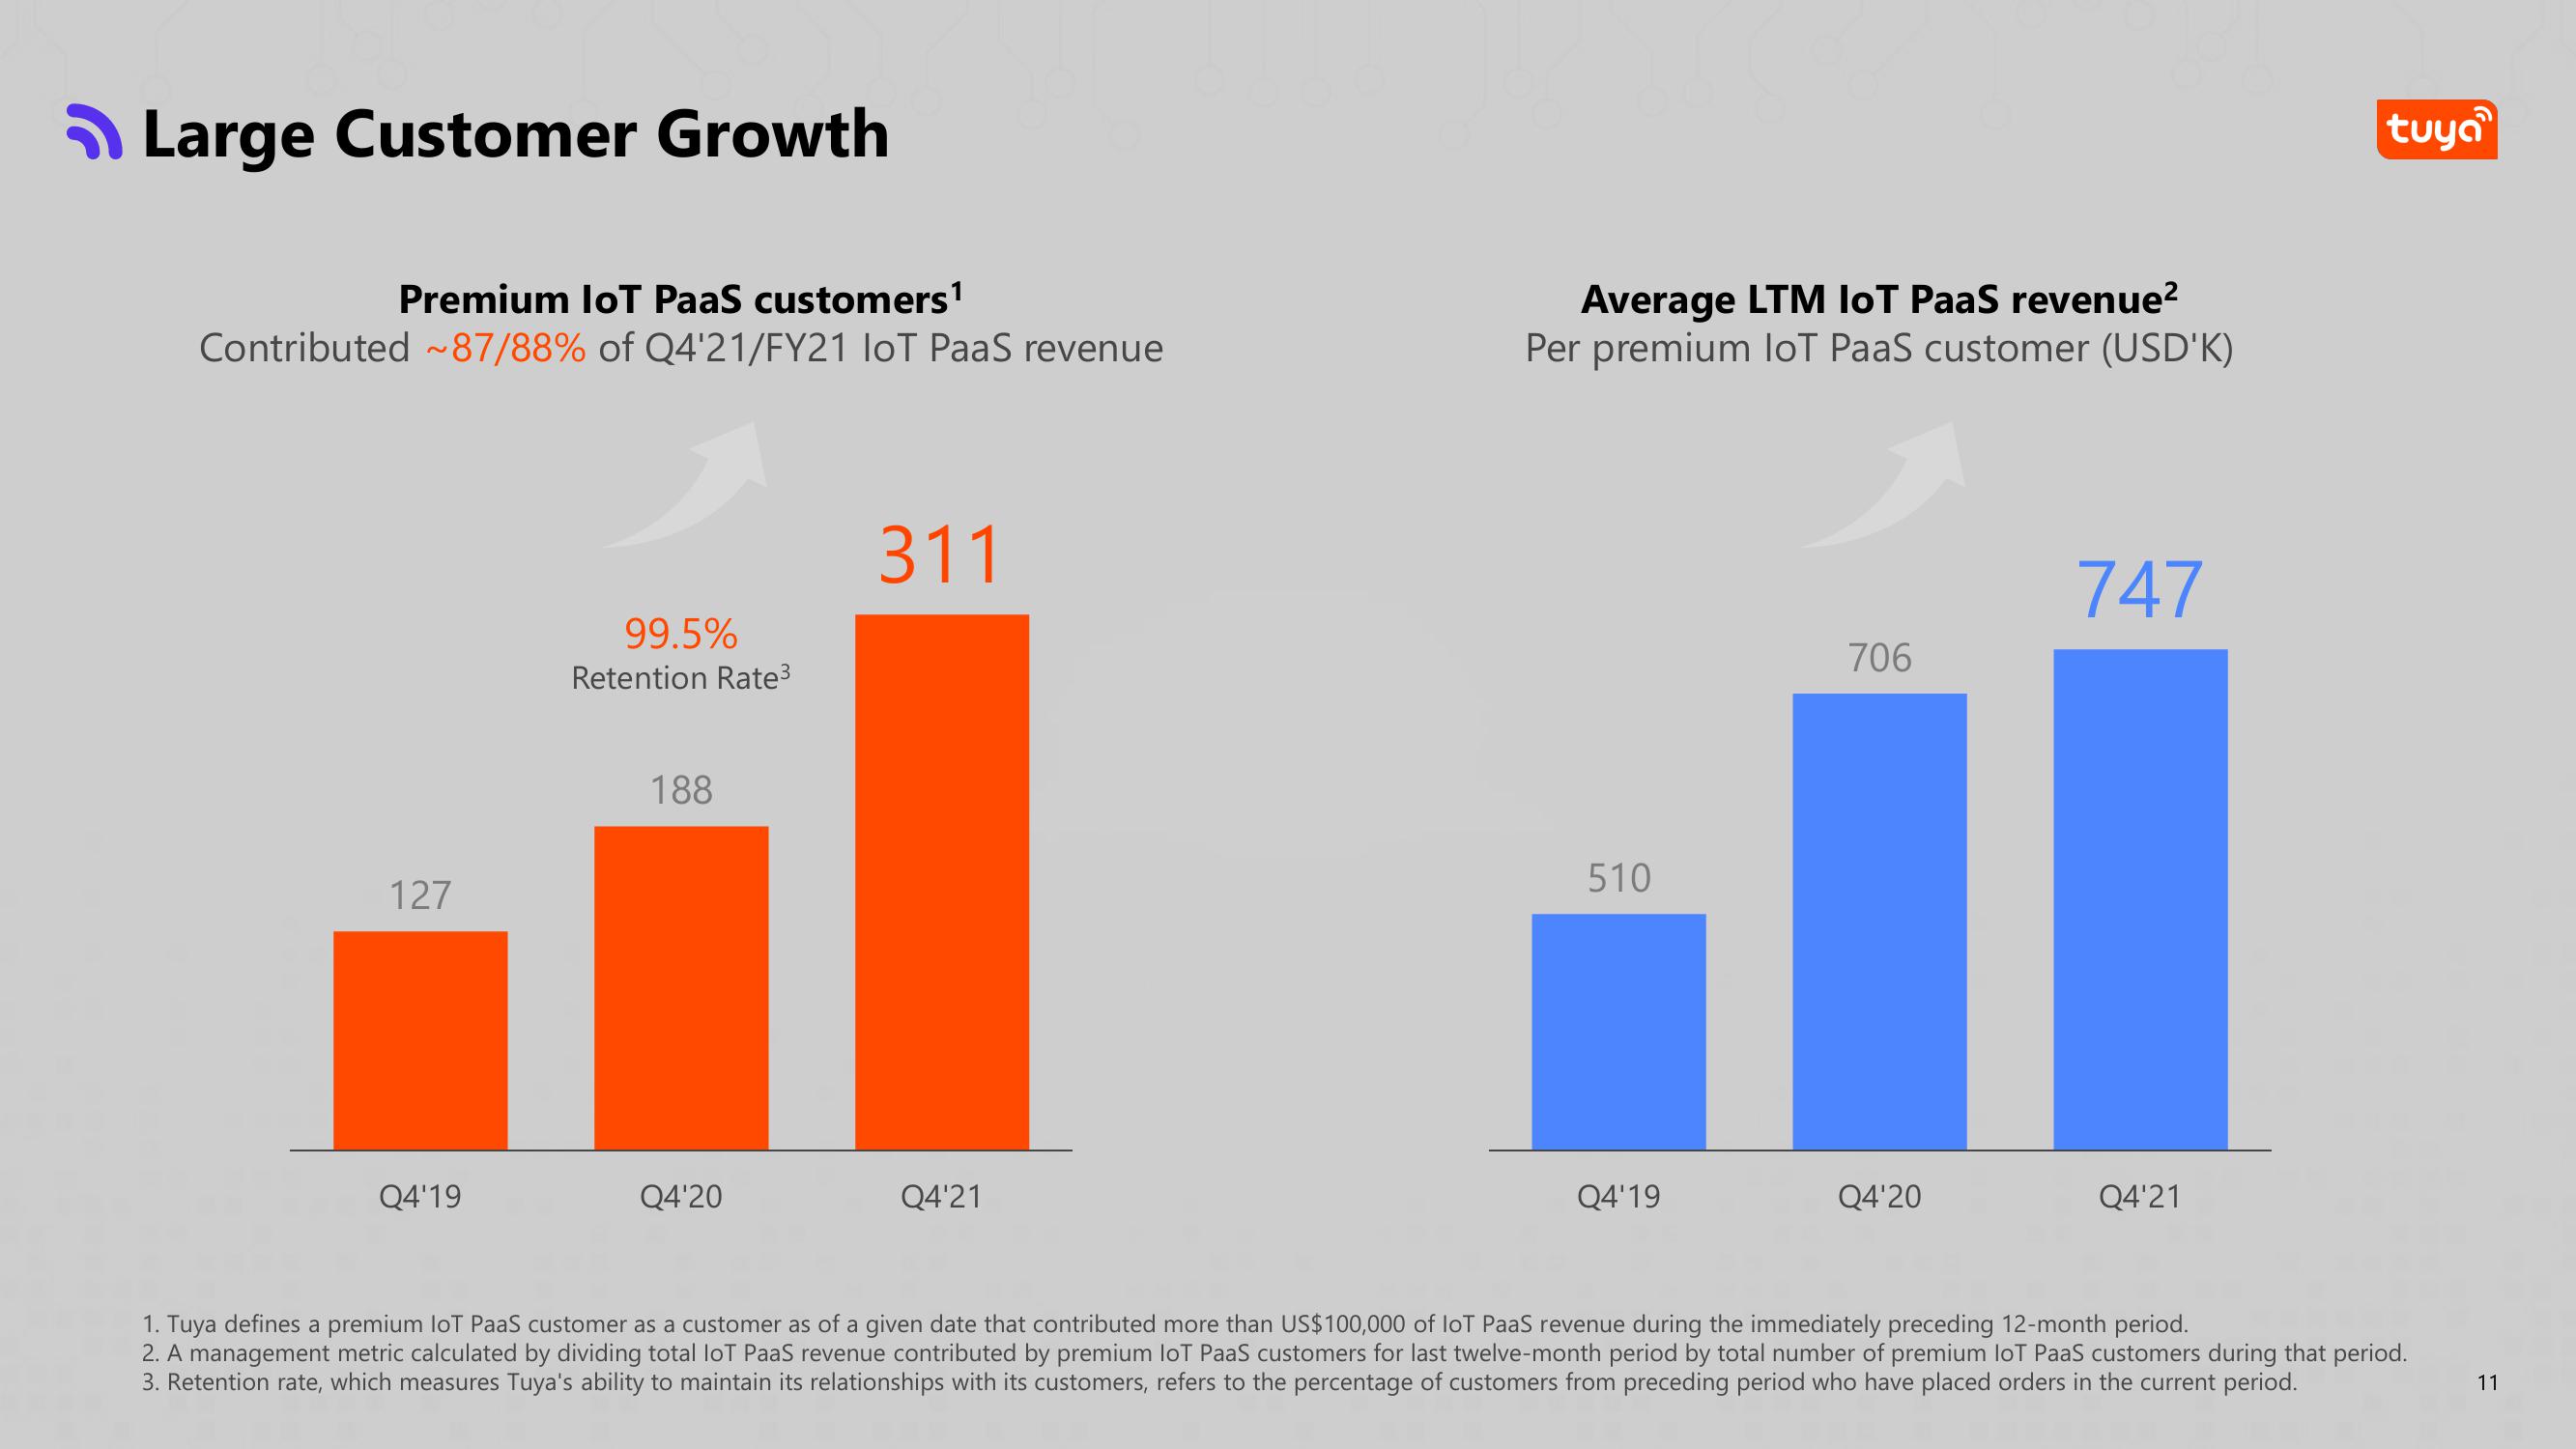
Large Customer Growth
Premium IoT PaaS customers¹
Contributed ~87/88% of Q4'21/FY21 IoT PaaS revenue
127
Q4'19
99.5%
Retention Rate³
188
Q4'20
311
Q4'21
Average LTM loT PaaS revenue²
Per premium loT PaaS customer (USD'K)
510
Q4'19
706
Q4'20
747
Q4'21
tuya
1. Tuya defines a premium loT PaaS customer as a customer as of a given date that contributed more than US$100,000 of loT PaaS revenue during the immediately preceding 12-month period.
2. A management metric calculated by dividing total loT PaaS revenue contributed by premium loT PaaS customers for last twelve-month period by total number of premium loT PaaS customers during that period.
3. Retention rate, which measures Tuya's ability to maintain its relationships with its customers, refers to the percentage of customers from preceding period who have placed orders in the current period.
11View entire presentation