Nuvei Results Presentation Deck
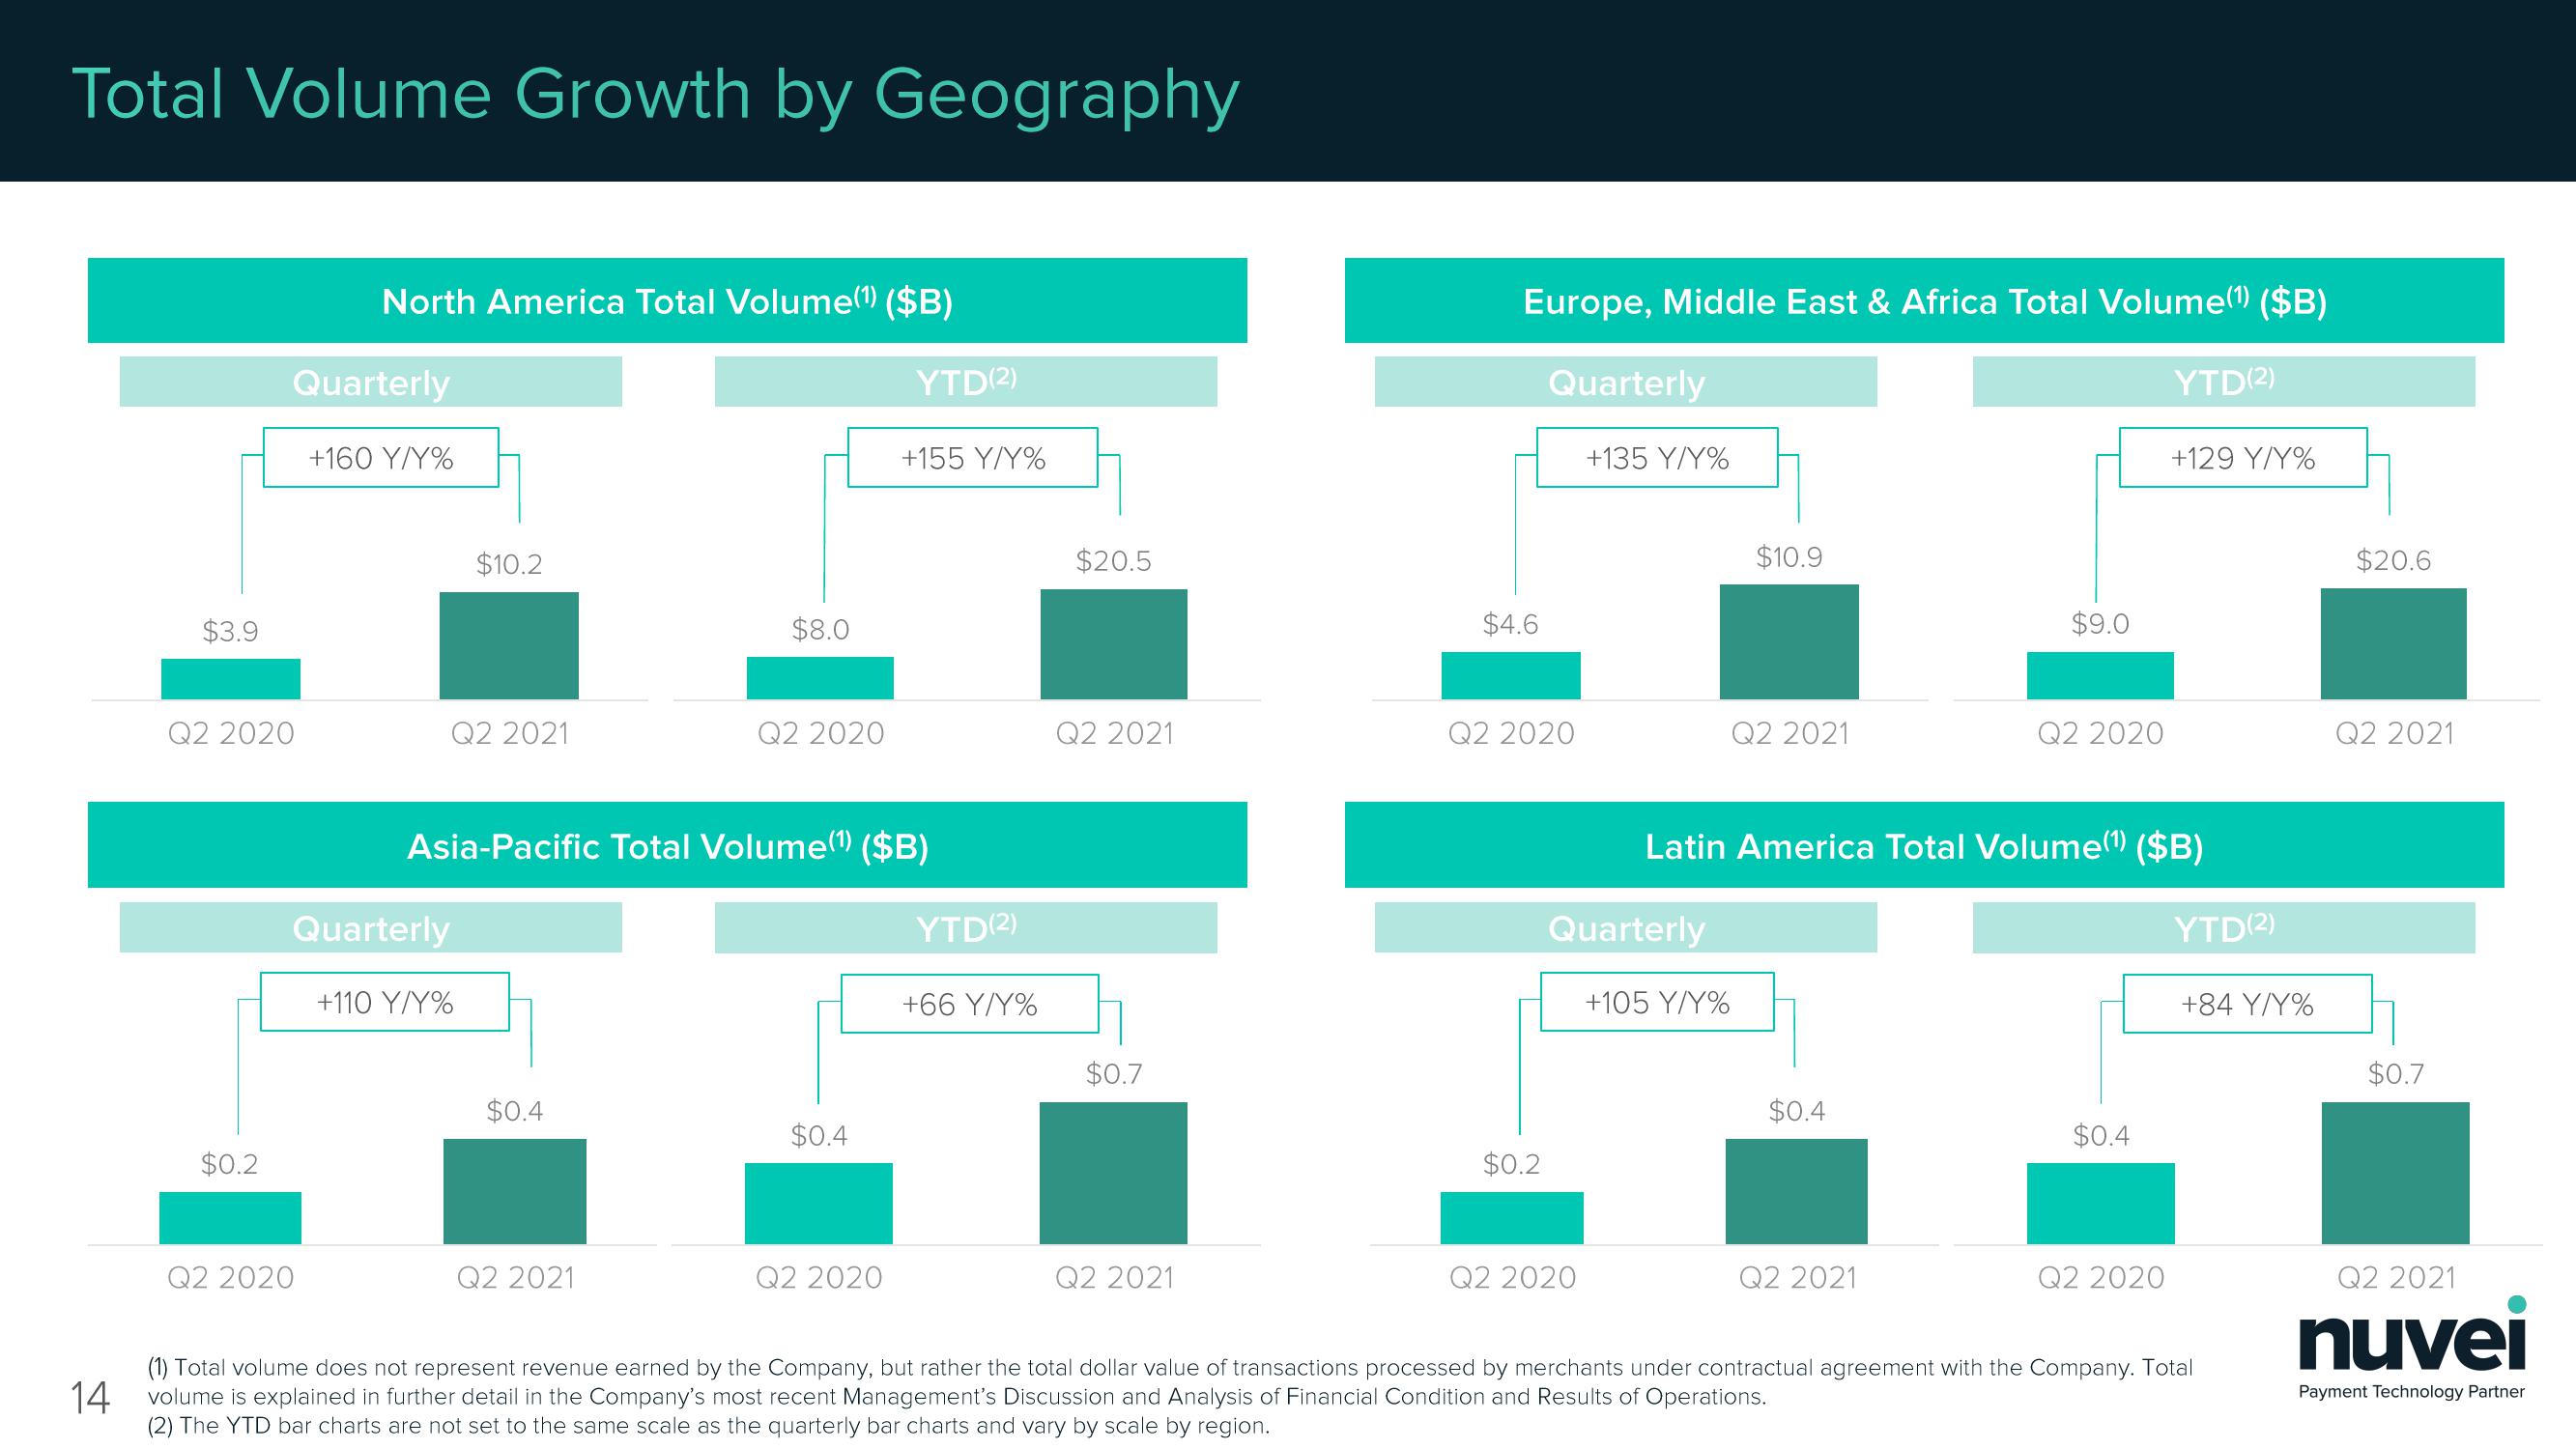
Total Volume Growth by Geography
$3.9
Q2 2020
$0.2
Quarterly
North America Total Volume(1) ($B)
Q2 2020
+160 Y/Y%
Q2 2021
Quarterly
$10.2
+110 Y/Y%
$0.4
$8.0
Asia-Pacific Total Volume(¹) ($B)
Q2 2021
Q2 2020
$0.4
YTD(2)
Q2 2020
+155 Y/Y%
YTD(2)
+66 Y/Y%
$20.5
Q2 2021
$0.7
Q2 2021
Europe, Middle East & Africa Total Volume(¹) ($B)
Quarterly
$4.6
Q2 2020
$0.2
+135 Y/Y%
Q2 2020
Quarterly
$10.9
+105 Y/Y%
Q2 2021
$0.4
$9.0
Latin America Total Volume(¹) ($B)
Q2 2021
Q2 2020
$0.4
YTD(²)
Q2 2020
+129 Y/Y%
YTD(2)
+84 Y/Y%
(1) Total volume does not represent revenue earned by the Company, but rather the total dollar value of transactions processed by merchants under contractual agreement with the Company. Total
14 volume is explained in further detail in the Company's most recent Management's Discussion and Analysis of Financial Condition and Results of Operations.
(2) The YTD bar charts are not set to the same scale as the quarterly bar charts and vary by scale by region.
$20.6
Q2 2021
$0.7
Q2 2021
nuvei
Payment Technology PartnerView entire presentation