OSP Value Fund IV LP Q4 2022
($ BILLIONS)
60
50
40
30
20
10
0
Source: FDIC, NBER
Loan Type
Jun 98
Jun 99
Jun 00
Jun 01
Jun 02
Jun 03
Jun 04
Jun 05
Performing
Performing/
Non-performing
Non-performing
Total
1990-2020
Quarterly Net
Charge-Offs
Non-Current Loans
Book $
Value
$18,181
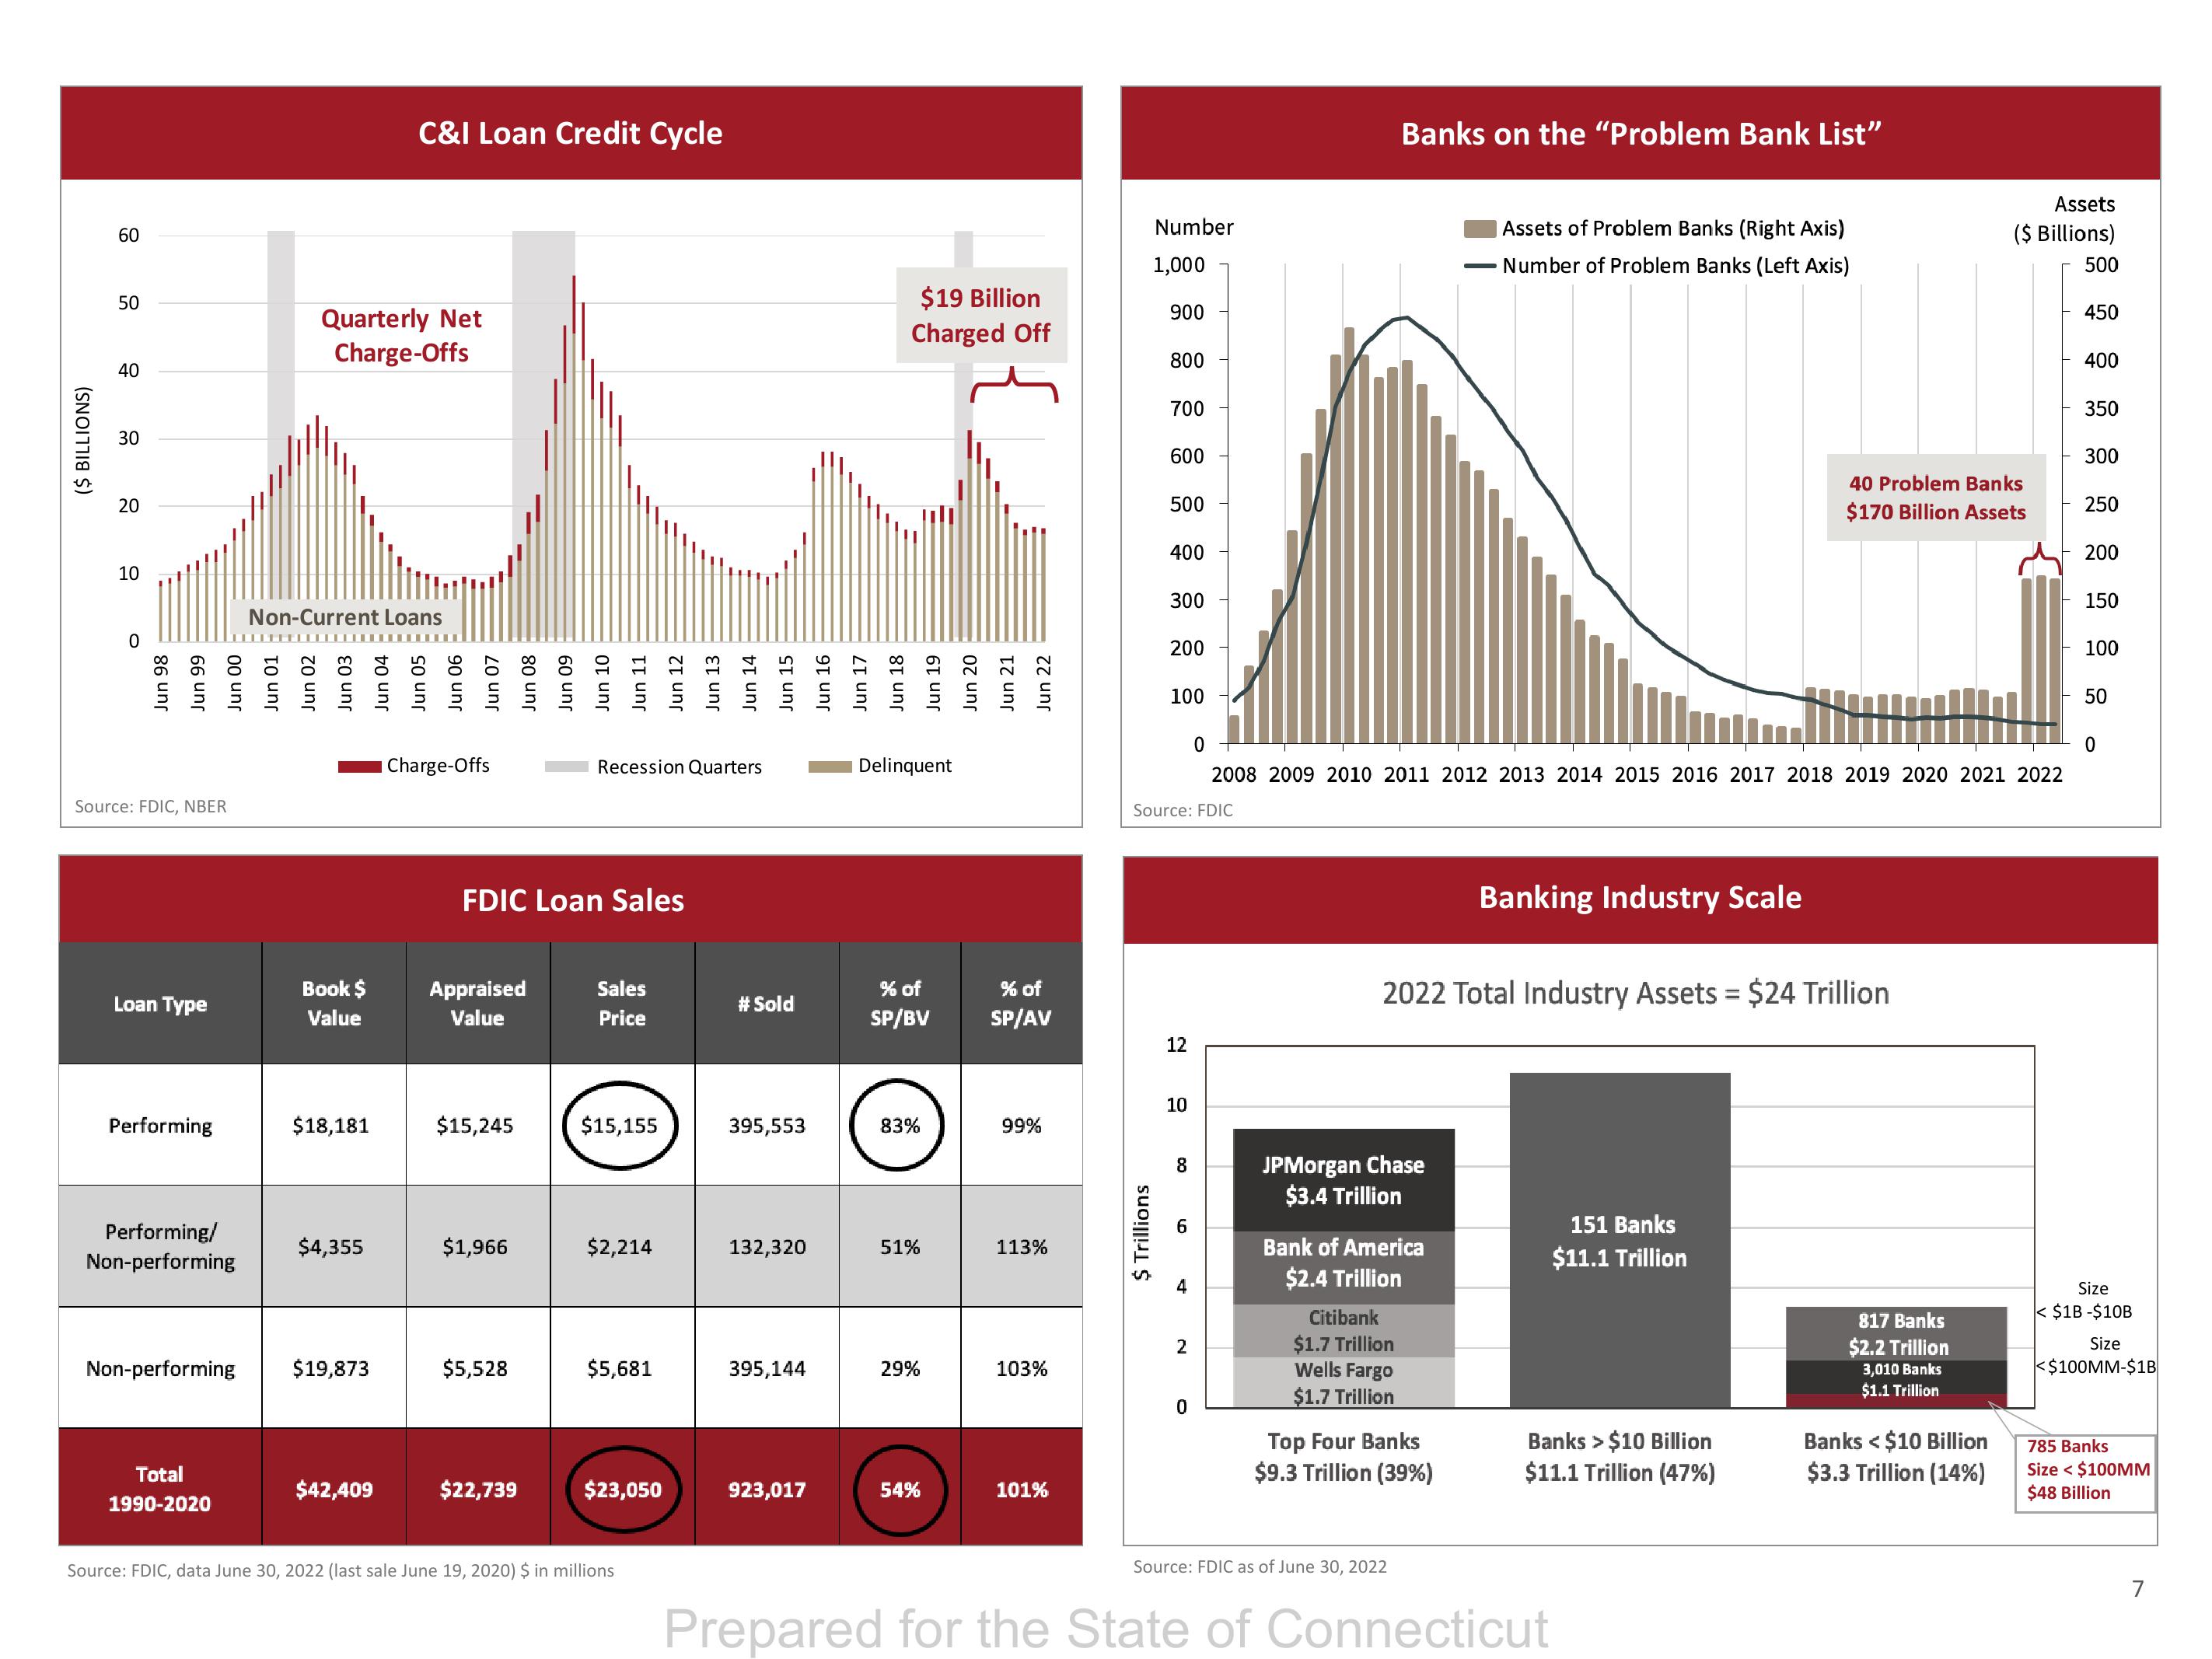
C&I Loan Credit Cycle
$4,355
$19,873
$42,409
90 unr
Jun 07
Jun 08
Charge-Offs
Appraised
Value
$15,245
$1,966
FDIC Loan Sales
$5,528
60 unr
$22,739
Jun 10
Recession Quarters
Jun 11
Jun 12
Jun 13
Jun 14
Jun 15
Jun 16
Jun 17
Jun 18
Jun 19
Jun 20
Sales
Price
$15,155
$2,214
$5,681
$23,050
Source: FDIC, data June 30, 2022 (last sale June 19, 2020) $ in millions
# Sold
395,553
132,320
395,144
$19 Billion
Charged Off
923,017
Delinquent
% of
SP/BV
83%
51%
29%
54%
Jun 21
Jun 22
% of
SP/AV
99%
113%
103%
101%
Number
1,000
$ Trillions
900
800
700
600
500
400
300
200
100
12
10
0
2008 2009 2010 2011 2012 2013 2014 2015 2016 2017 2018 2019 2020 2021 2022
Source: FDIC
co
6
4
2
0
Banks on the "Problem Bank List"
JPMorgan Chase
$3.4 Trillion
Bank of America
$2.4 Trillion
Citibank
$1.7 Trillion
Wells Fargo
$1.7 Trillion
2022 Total Industry Assets = $24 Trillion
Assets of Problem Banks (Right Axis)
- Number of Problem Banks (Left Axis)
Top Four Banks
$9.3 Trillion (39%)
Source: FDIC as of June 30, 2022
Banking Industry Scale
151 Banks
$11.1 Trillion
Banks > $10 Billion
$11.1 Trillion (47%)
Prepared for the State of Connecticut
40 Problem Banks
$170 Billion Assets
Assets
($ Billions)
500
817 Banks
$2.2 Trillion
3,010 Banks
$1.1 Trillion
Banks <$10 Billion
$3.3 Trillion (14%)
450
400
350
300
250
200
150
100
50
0
Size
< $1B-$10B
Size
<$100MM-$1B
785 Banks
Size < $100MM
$48 Billion
7View entire presentation