Lyft Results Presentation Deck
GAAP to Non-GAAP Reconciliations (cont.)
($ in millions)
Gross Bookings¹
Non-GAAP Cost of Revenue
Non-GAAP Cost of Revenue as a % of Gross Bookings
Non-GAAP Operations and Support
Non-GAAP Operations and Support as a % of Gross Bookings
Non-GAAP Research and Development
Non-GAAP Research and Development as a % of Gross
Bookings
Non-GAAP Sales and Marketing
Non-GAAP Sales and Marketing as a % of Gross Bookings
Non-GAAP General and Administrative
Non-GAAP General and Administrative as a % of Gross
Bookings
Non-GAAP Operating Expenses (excludes COR)
Non-GAAP Operating Expenses (excludes COR) as a % of Gross
Bookings
Non-GAAP Total Costs and Expenses
Non-GAAP Total Costs and Expenses as a % of Gross Bookings
(1)
Note:
Fiscal 2021
Total
$9,745.7
(1,577.0)
(16.2%)
(376.5)
(3.9%)
(471.9)
(4.8%)
(370.2)
(3.8%)
(692.4)
(7.1%)
(1,911.1)
(19.6%)
(3,488.0)
(35.8%)
Q1
$ 2,694.2
(373.1)
(13.8%)
(92.4)
(3.4%)
(102.7)
(3.8%)
(114.8)
(4.3%)
(166.6)
(6.2%)
(476.5)
(17.7%)
(849.6)
(31.5%)
Q2
$3,092.9
(675.7)
(21.8%)
(98.6)
(3.2%)
(105.7)
(3.4%)
(128.3)
(4.1%)
(203.7)
(6.6%)
(536.2)
(17.3%)
(1,211.9)
(39.2%)
Fiscal 2022
Q3
$3,079.2
(556.3)
(18.1%)
(111.6)
(3.6%)
(107.7)
(3.5%)
(118.7)
(3.9%)
(216.9)
(7.0%)
(555.0)
(18.0%)
(1,111.3)
(36.1%)
Q4
$ 3,191.0
(760.3)
(23.8%)
(95.1)
(3.0%)
(103.5)
(3.2%)
(114.4)
(3.6%)
(379.0)
(11.9%)
(692.0)
(21.7%)
(1,452.2)
(45.5%)
Total
$12,057.3
(2,365.4)
(19.6%)
(397.8)
(3.3%)
(419.6)
(3.5%)
(476.2)
(3.9%)
(966.2)
(8.0%)
(2,259.7)
(18.7%)
(4,625.1)
(38.4%)
Q1
$ 3,050.7
(535.4)
(17.6%)
(79.6)
(2.6%)
(96.2)
(3.2%)
(103.7)
(3.4%)
(185.6)
(6.1%)
(465.2)
(15.2%)
(1,000.6)
(32.8%)
Fiscal 2023
Q2
$ 3,446.0
(594.5)
(17.3%)
(94.4)
(2.7%)
(81.7)
(2.4%)
(95.8)
(2.8%)
(138.0)
(4.0%)
(409.9)
(11.9%)
(1,004.4)
(29.1%)
Q3
$3,554.1
(637.6)
(17.9%)
(115.7)
(3.3%)
(66.5)
(1.9%)
(123.9)
(3.5%)
(148.3)
(4.2%)
(454.5)
(12.8%)
(1,092.1)
(30.7%)
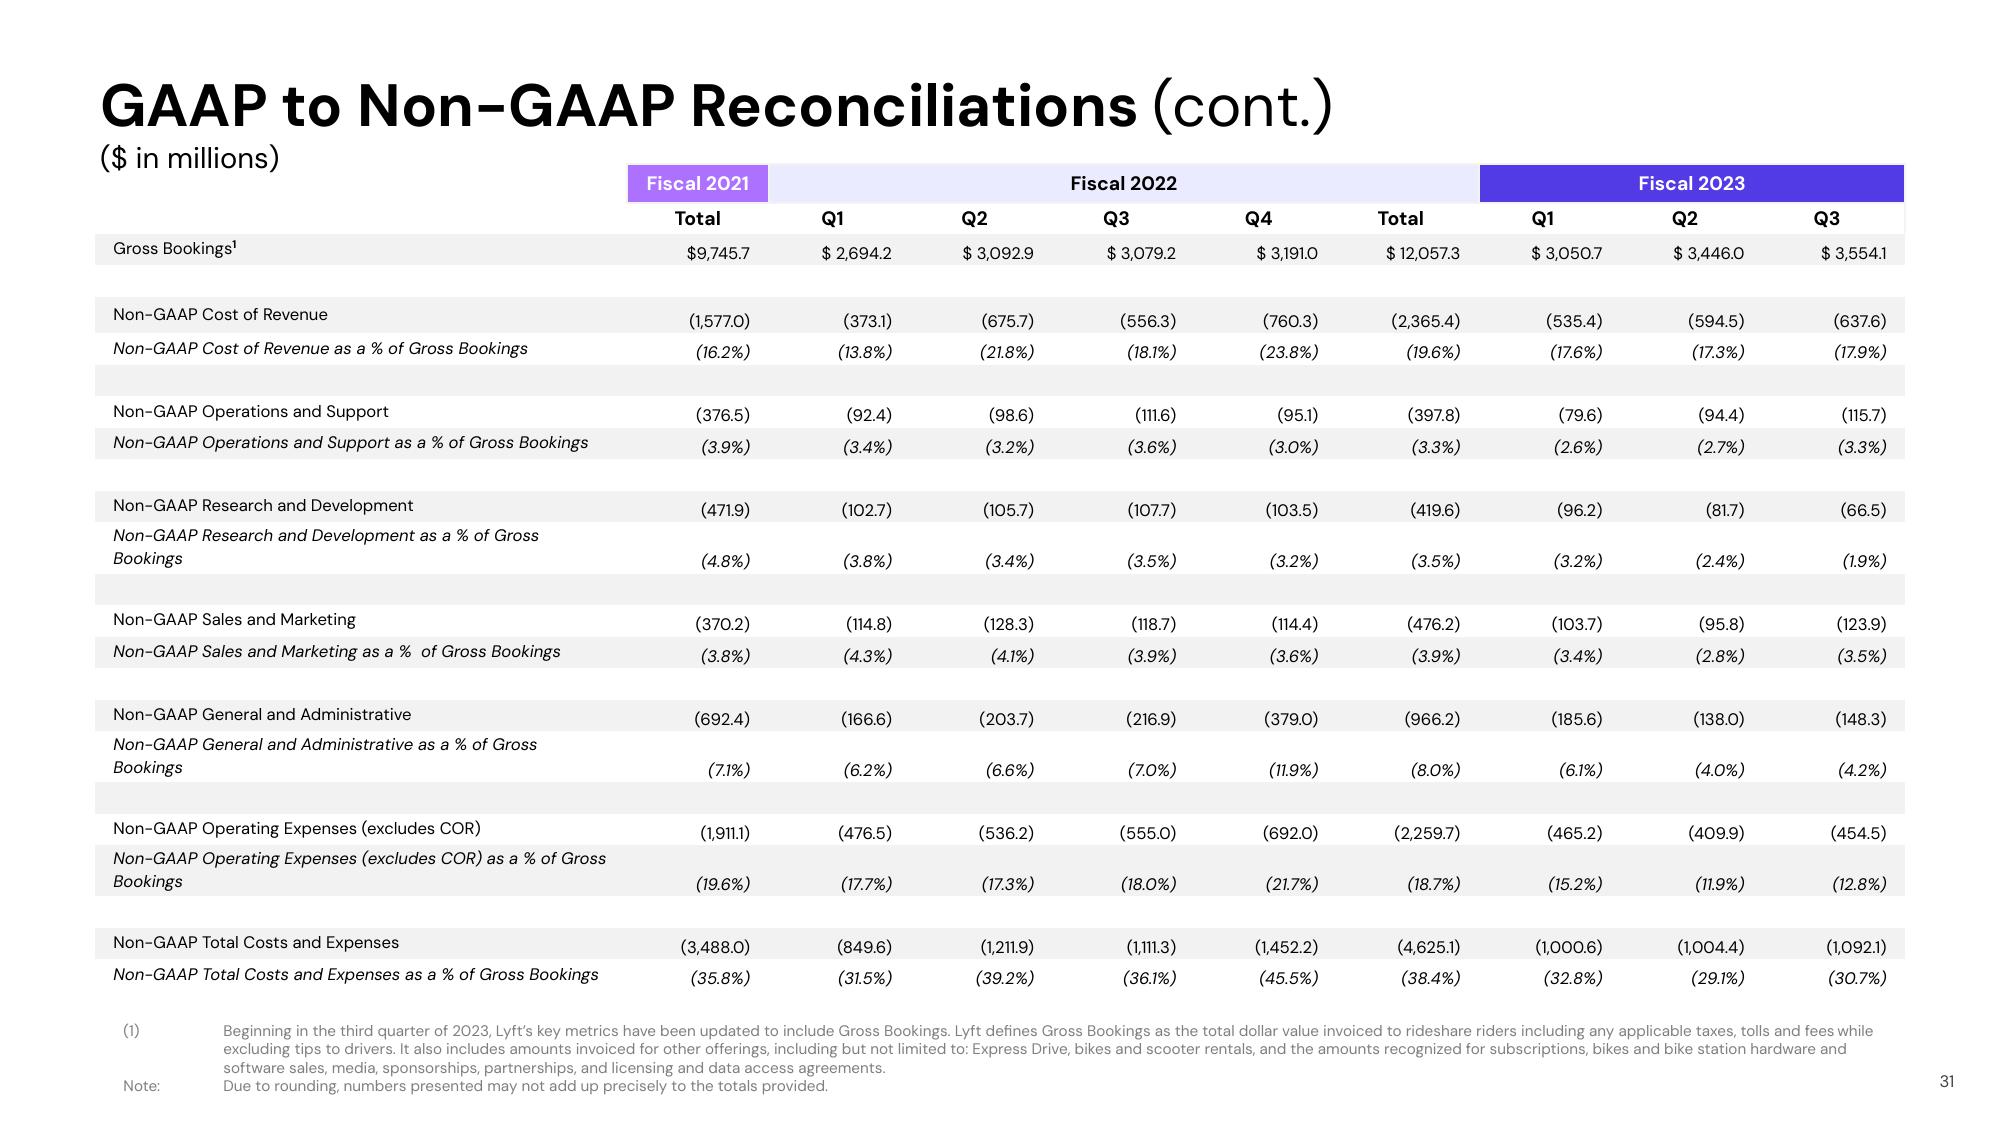
Beginning in the third quarter of 2023, Lyft's key metrics have been updated to include Gross Bookings. Lyft defines Gross Bookings as the total dollar value invoiced to rideshare riders including any applicable taxes, tolls and fees while
excluding tips to drivers. It also includes amounts invoiced for other offerings, including but not limited to: Express Drive, bikes and scooter rentals, and the amounts recognized for subscriptions, bikes and bike station hardware and
software sales, media, sponsorships, partnerships, and licensing and data access agreements.
Due to rounding, numbers presented may not add up precisely to the totals provided.
31View entire presentation