Bird SPAC Presentation Deck
BIRD
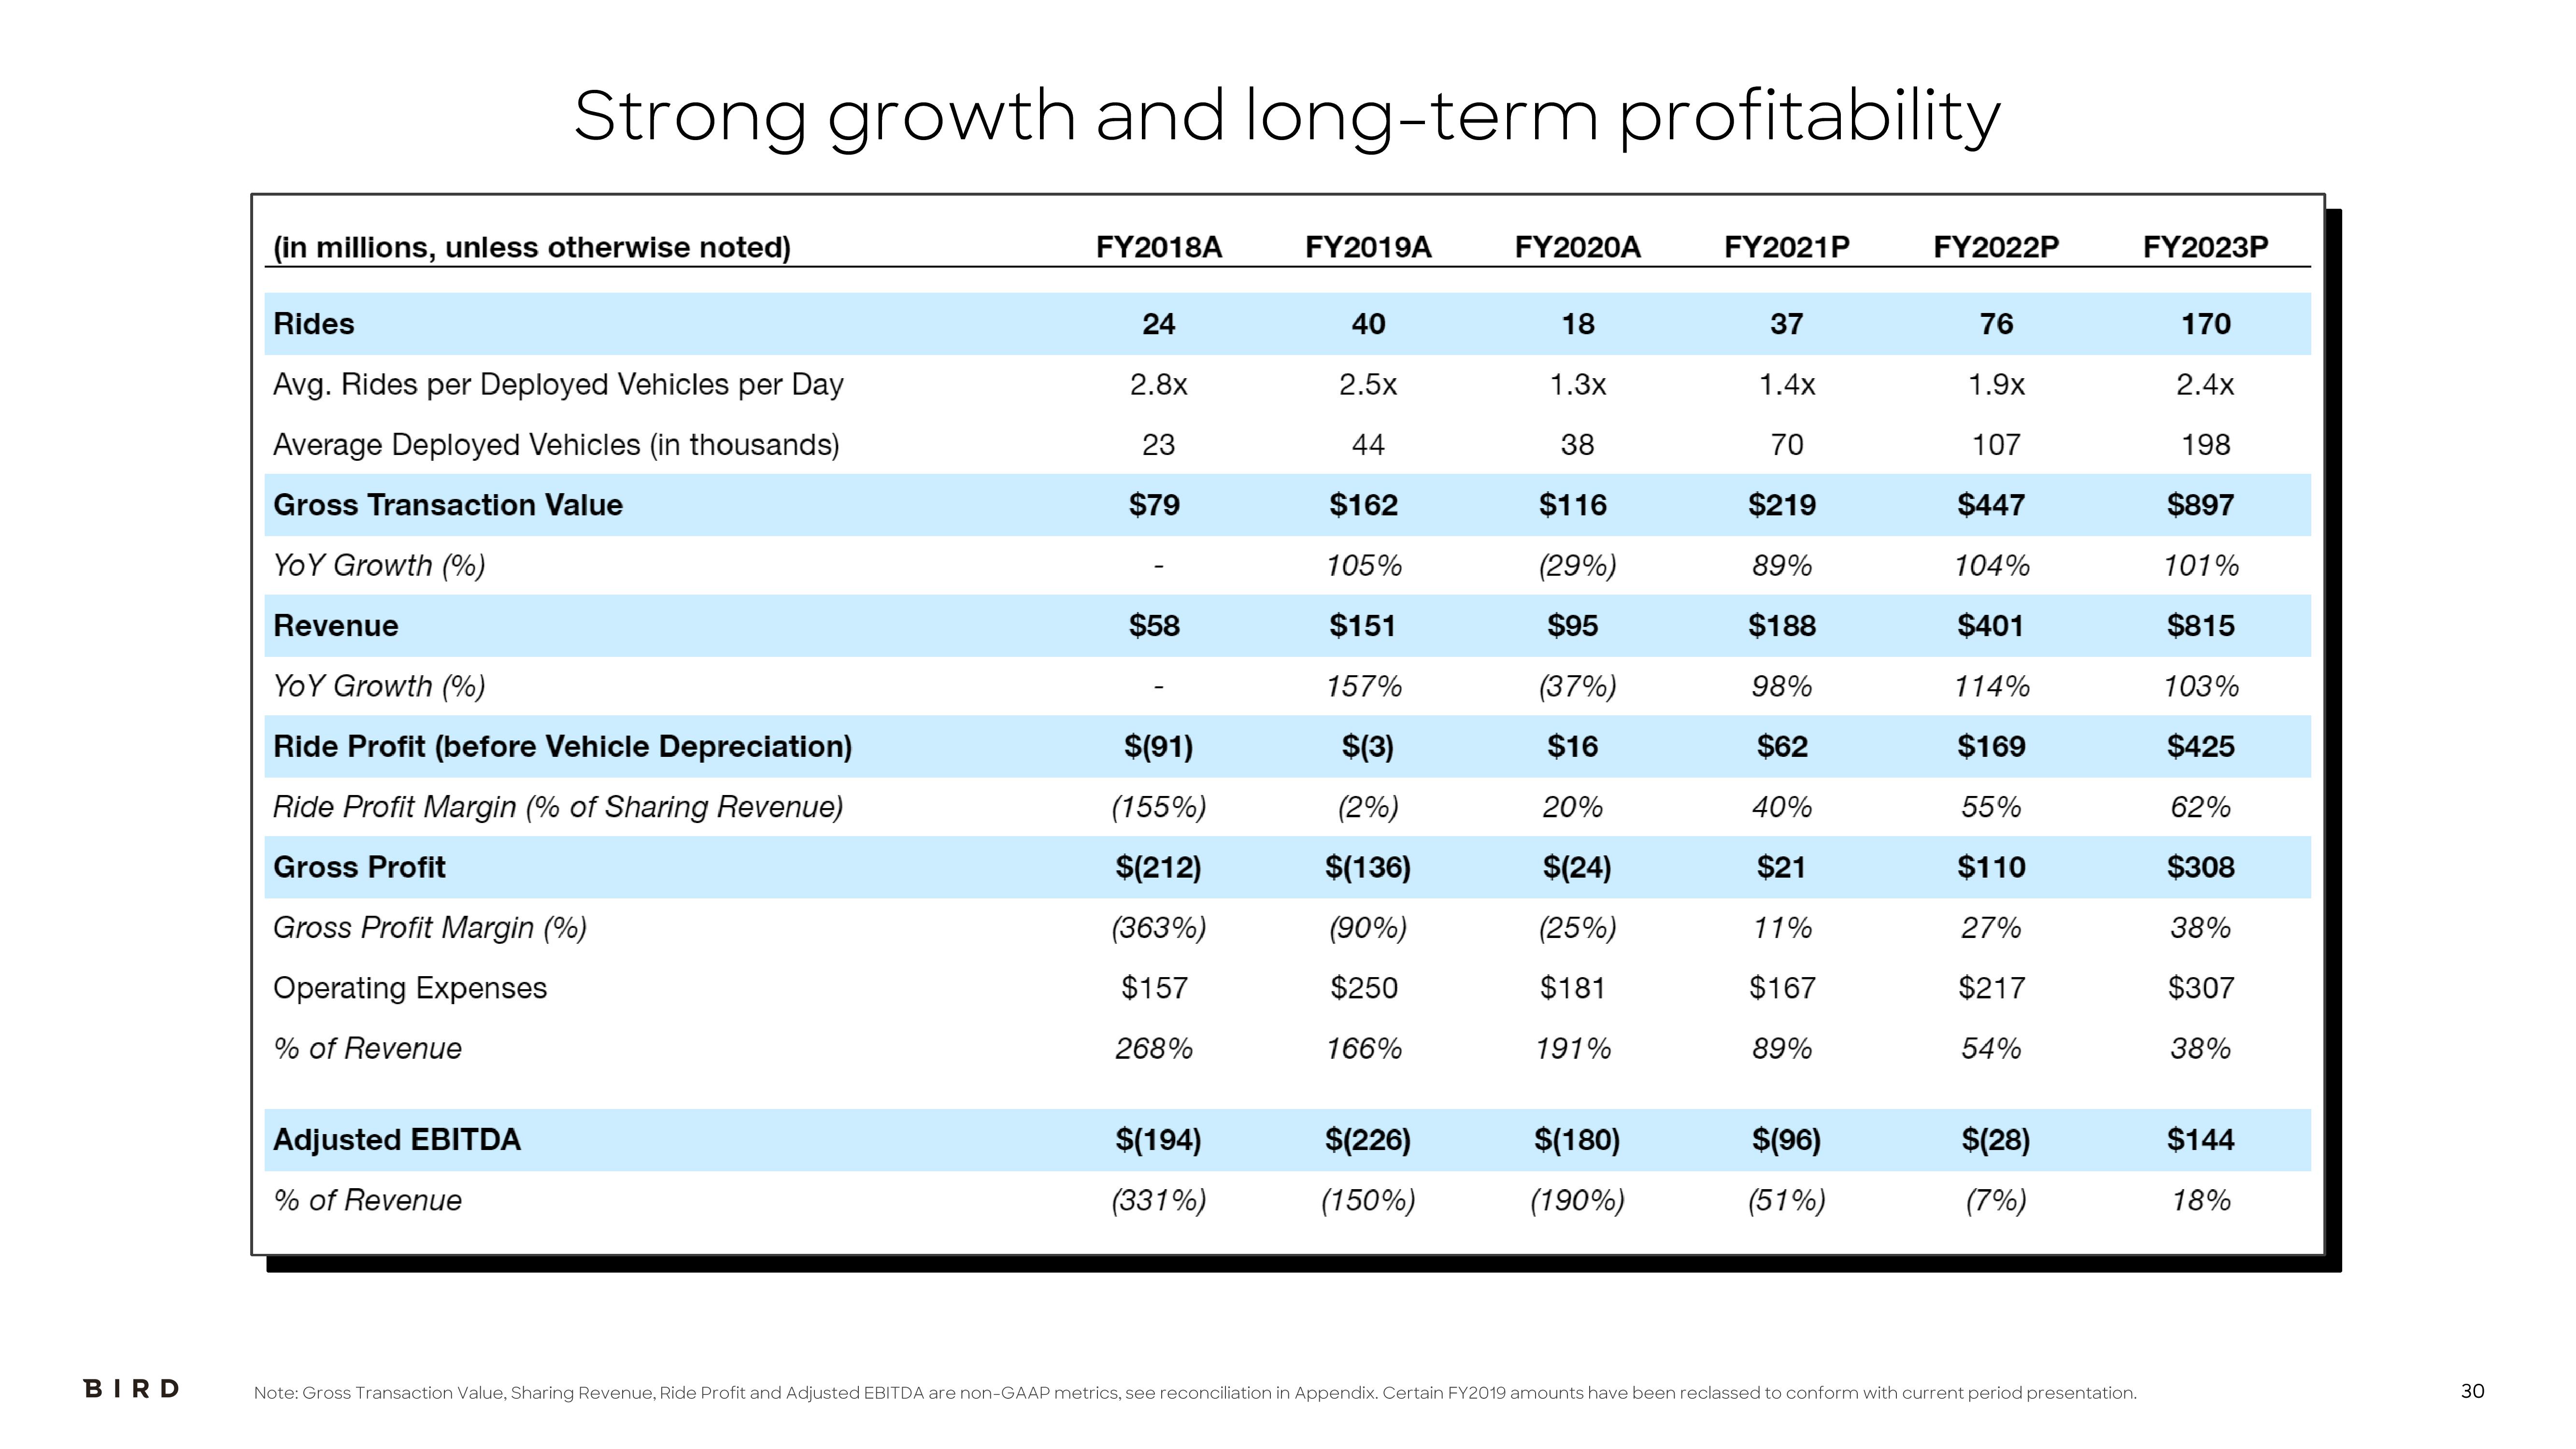
Strong growth and long-term profitability
(in millions, unless otherwise noted)
Rides
Avg. Rides per Deployed Vehicles per Day
Average Deployed Vehicles (in thousands)
Gross Transaction Value
YOY Growth (%)
Revenue
YOY Growth (%)
Ride Profit (before Vehicle Depreciation)
Ride Profit Margin (% of Sharing Revenue)
Gross Profit
Gross Profit Margin (%)
Operating Expenses
% of Revenue
Adjusted EBITDA
% of Revenue
FY2018A
24
2.8x
23
$79
$58
$(91)
(155%)
$(212)
(363%)
$157
268%
$(194)
(331%)
FY2019A
40
2.5x
44
$162
105%
$151
157%
$(3)
(2%)
$(136)
(90%)
$250
166%
$(226)
(150%)
FY2020A
18
1.3x
38
$116
(29%)
$95
(37%)
$16
20%
$(24)
(25%)
$181
191%
$(180)
(190%)
FY2021P
37
1.4x
70
$219
89%
$188
98%
$62
40%
$21
11%
$167
89%
$(96)
(51%)
FY2022P
76
1.9x
107
$447
104%
$401
114%
$169
55%
$110
27%
$217
54%
$(28)
(7%)
Note: Gross Transaction Value, Sharing Revenue, Ride Profit and Adjusted EBITDA are non-GAAP metrics, see reconciliation in Appendix. Certain FY2019 amounts have been reclassed to conform with current period presentation.
FY2023P
170
2.4x
198
$897
101%
$815
103%
$425
62%
$308
38%
$307
38%
$144
18%
30View entire presentation