Q2 FY24 Earnings Presentation
13.
3.
FY24 guidance
-
- UPDATED
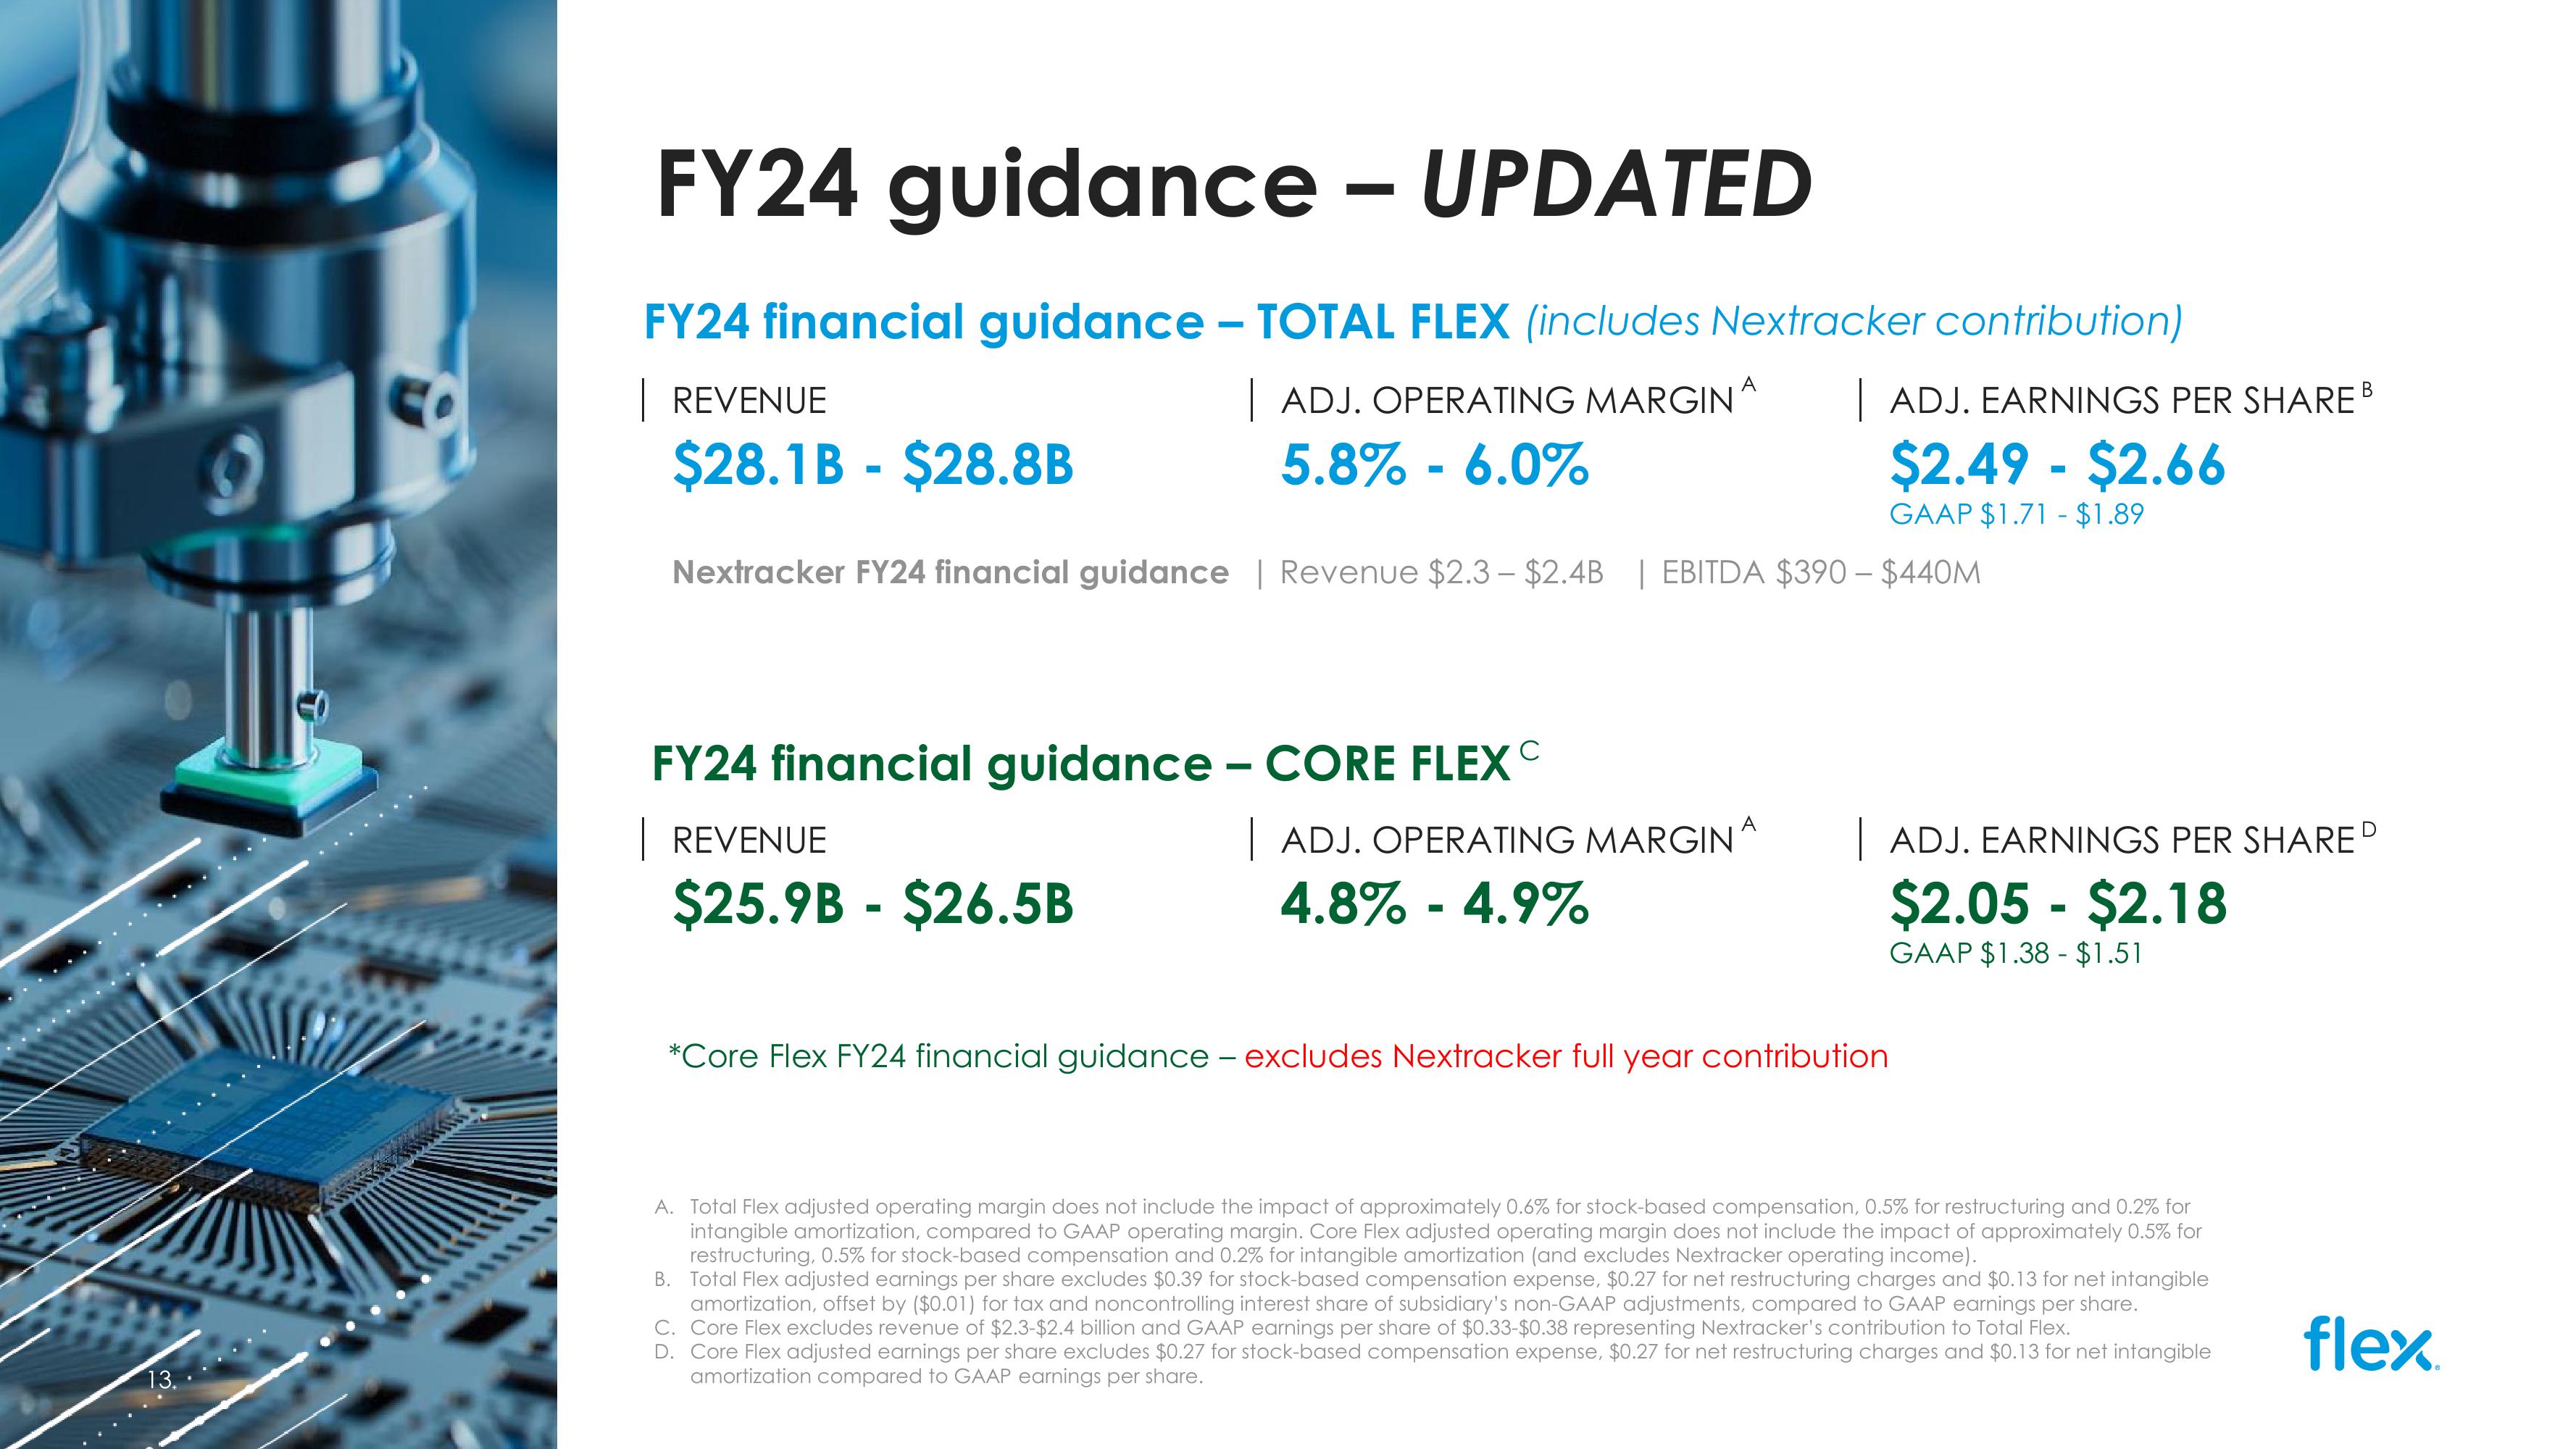
FY24 financial guidance - TOTAL FLEX (includes Nextracker contribution)
| REVENUE
$28.1B - $28.8B
| ADJ. OPERATING MARGINA
5.8% -6.0%
| ADJ. EARNINGS PER SHARE B
$2.49 - $2.66
GAAP $1.71 - $1.89
Nextracker FY24 financial guidance | Revenue $2.3 - $2.4B | EBITDA $390 - $440M
FY24 financial guidance - CORE FLEX
| REVENUE
$25.9B - $26.5B
C
| ADJ. OPERATING MARGIN
A
4.8% - 4.9%
| ADJ. EARNINGS PER SHARED
$2.05 - $2.18
GAAP $1.38 $1.51
*Core Flex FY24 financial guidance - excludes Nextracker full year contribution
A. Total Flex adjusted operating margin does not include the impact of approximately 0.6% for stock-based compensation, 0.5% for restructuring and 0.2% for
intangible amortization, compared to GAAP operating margin. Core Flex adjusted operating margin does not include the impact of approximately 0.5% for
restructuring, 0.5% for stock-based compensation and 0.2% for intangible amortization (and excludes Nextracker operating income).
B. Total Flex adjusted earnings per share excludes $0.39 for stock-based compensation expense, $0.27 for net restructuring charges and $0.13 for net intangible
amortization, offset by ($0.01) for tax and noncontrolling interest share of subsidiary's non-GAAP adjustments, compared to GAAP earnings per share.
C. Core Flex excludes revenue of $2.3-$2.4 billion and GAAP earnings per share of $0.33-$0.38 representing Nextracker's contribution to Total Flex.
D. Core Flex adjusted earnings per share excludes $0.27 for stock-based compensation expense, $0.27 for net restructuring charges and $0.13 for net intangible
amortization compared to GAAP earnings per share.
flex.View entire presentation