Paysafe Results Presentation Deck
Q2 financial highlights
Volume ($bn)
$22.7
Q2 2020
$110.4
Paysafe:
Q2 2020
margin 32.4%
+41%
Adj. EBITDA (¹) ($m)
(1)
(2)
$32.3
+8%
Q2 2021
$118.8
Q2 2021
30.9%
+9%
Ex. PL
take rate
Revenue ($m)
$341.0
Q2 2020
1.5%
$96.2
+13%
Q2 2020
$384.3
FCF(¹) ($m)
Q2 2021
1.2%
$54.6
Q2 2021
+16%
Ex. PL
●
●
●
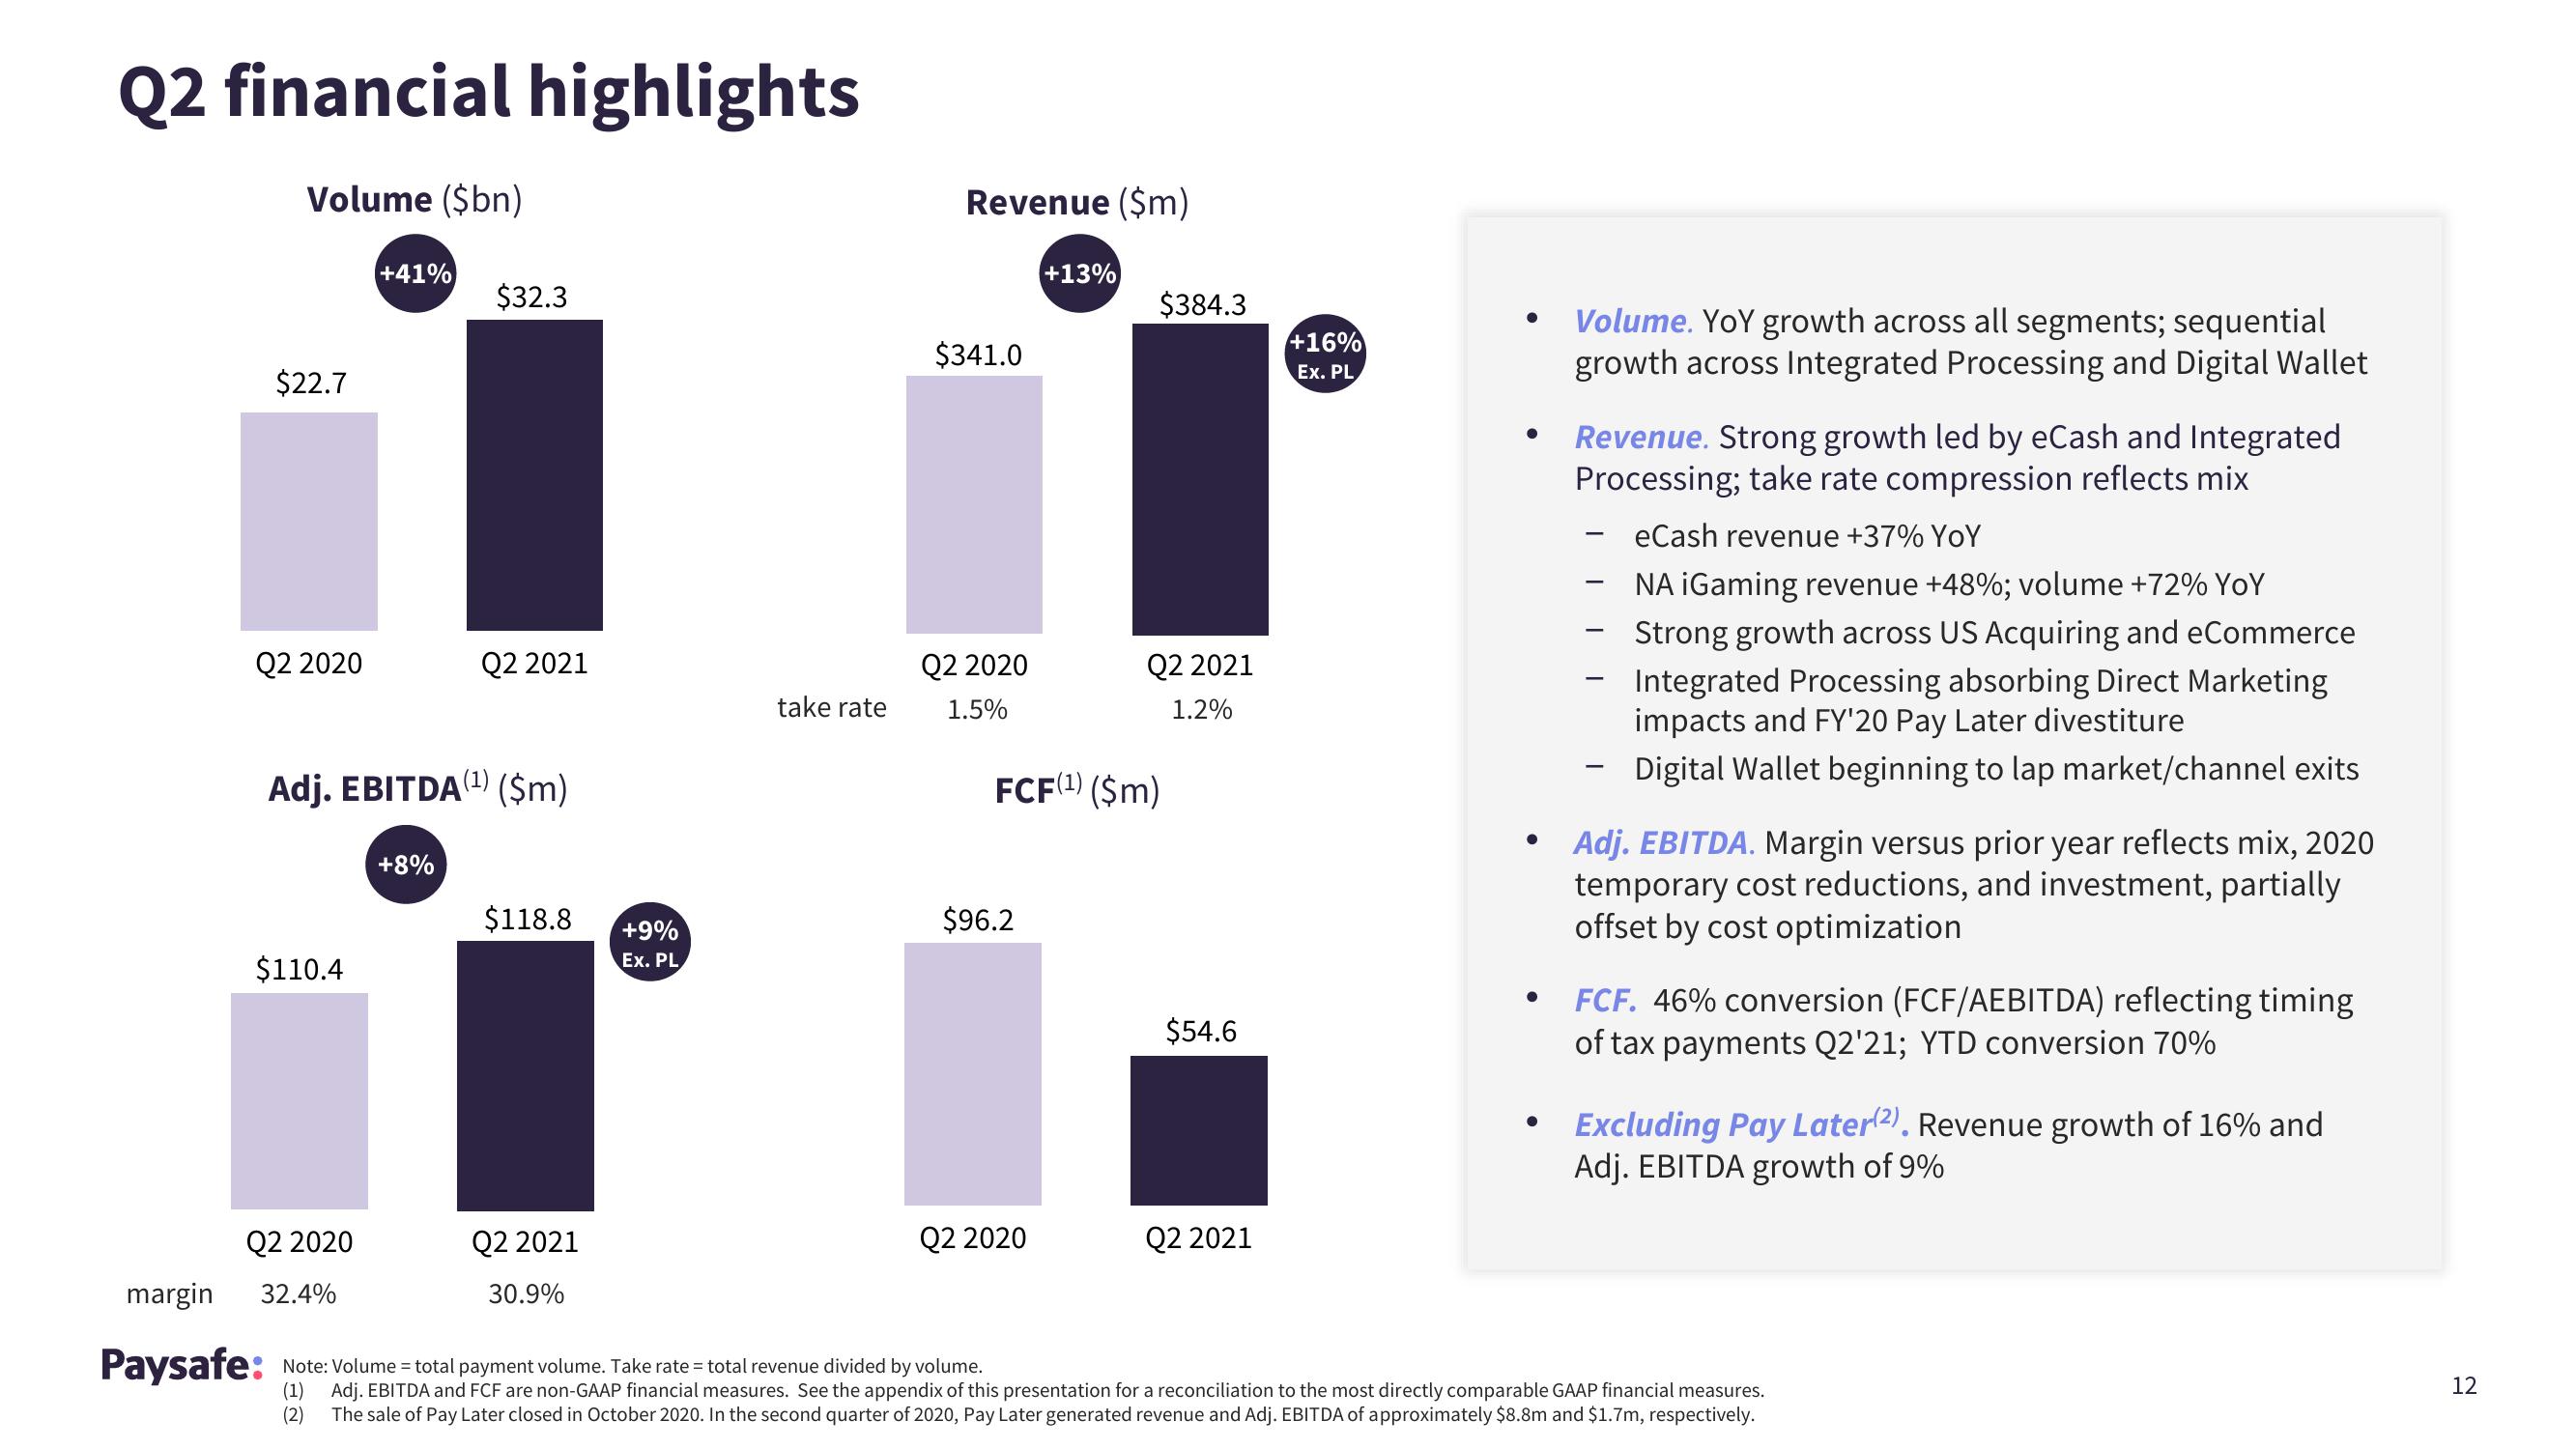
Volume. YoY growth across all segments; sequential
growth across Integrated Processing and Digital Wallet
Revenue. Strong growth led by eCash and Integrated
Processing; take rate compression reflects mix
eCash revenue +37% YoY
NA iGaming revenue +48%; volume +72% YoY
Strong growth across US Acquiring and eCommerce
Integrated Processing absorbing Direct Marketing
impacts and FY'20 Pay Later divestiture
Digital Wallet beginning to lap market/channel exits
-
-
Adj. EBITDA. Margin versus prior year reflects mix, 2020
temporary cost reductions, and investment, partially
offset by cost optimization
FCF. 46% conversion (FCF/AEBITDA) reflecting timing
of tax payments Q2'21; YTD conversion 70%
Excluding Pay Later(2). Revenue growth of 16% and
Adj. EBITDA growth of 9%
Note: Volume = total payment volume. Take rate = total revenue divided by volume.
Adj. EBITDA and FCF are non-GAAP financial measures. See the appendix of this presentation for a reconciliation to the most directly comparable GAAP financial measures.
The sale of Pay Later closed in October 2020. In the second quarter of 2020, Pay Later generated revenue and Adj. EBITDA of approximately $8.8m and $1.7m, respectively.
12View entire presentation