SoftBank Investor Presentation Deck
SVF1
SVF2
DRIVING FUTURE SUCCESS
Sustainable Financial Performance
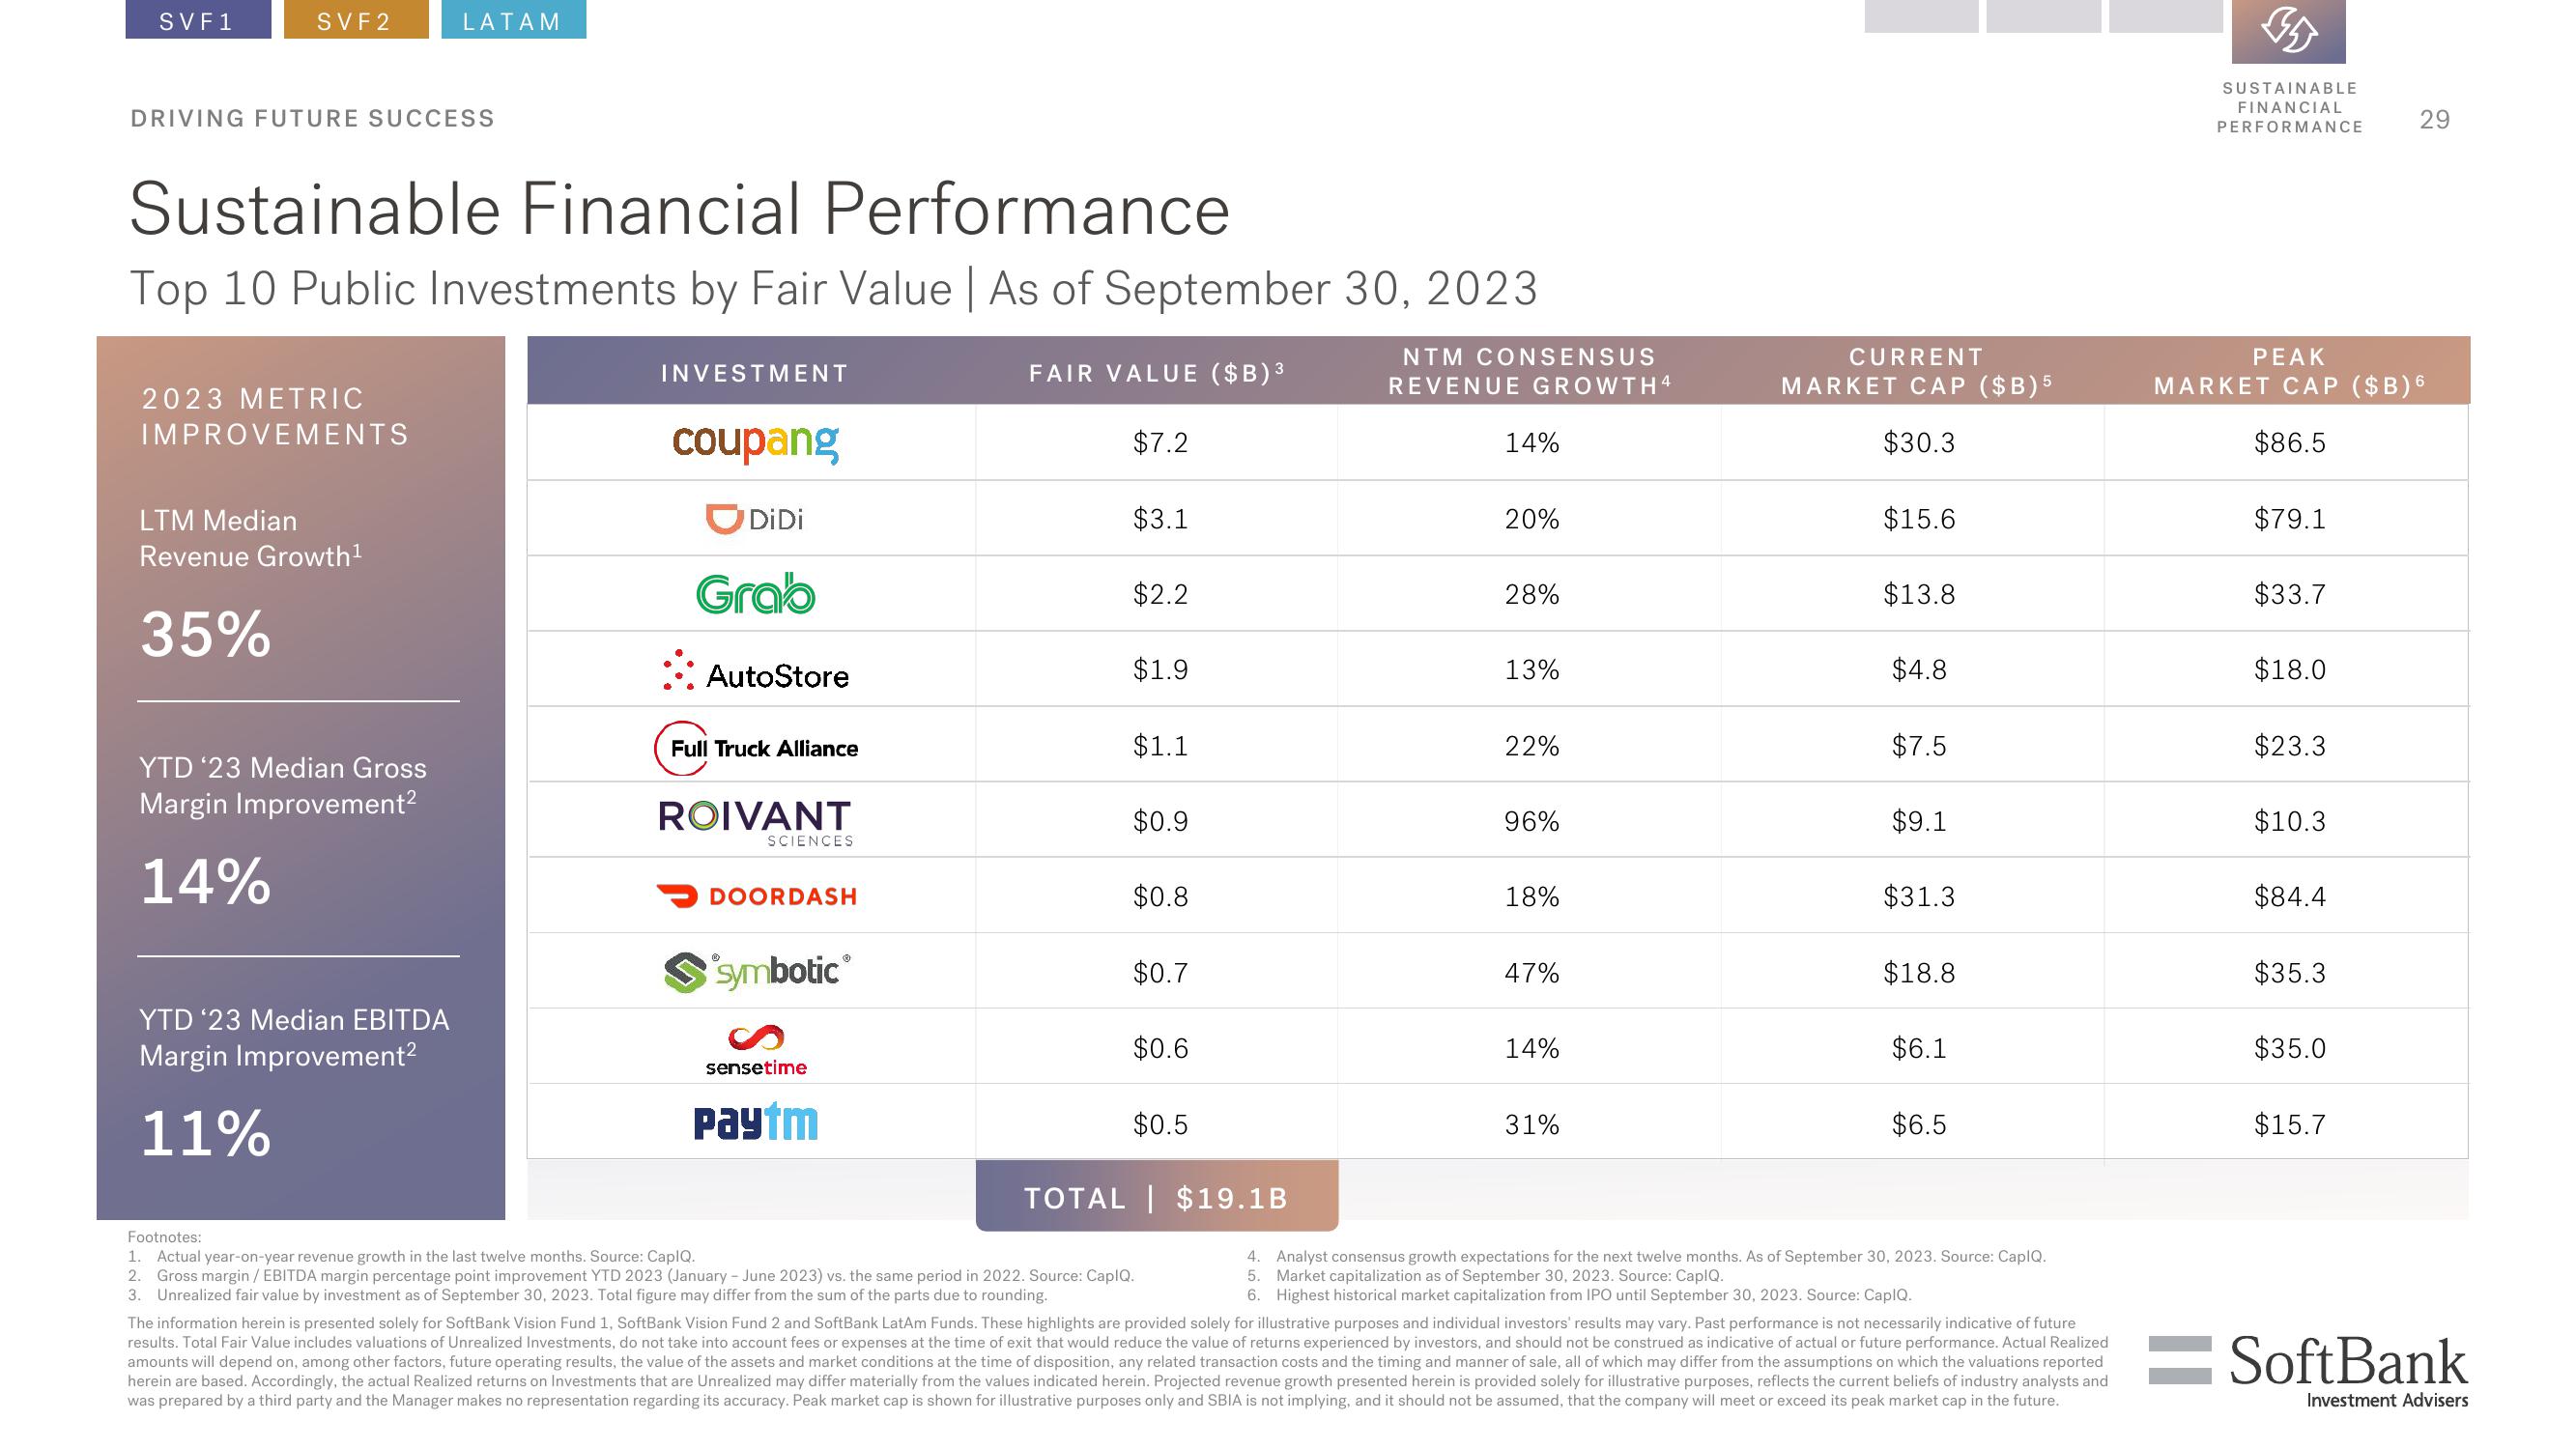
Top 10 Public Investments by Fair Value | As of September 30, 2023
2023 METRIC
IMPROVEMENTS
LTM Median
Revenue Growth¹
35%
LATAM
YTD '23 Median Gross
Margin Improvement²
14%
YTD '23 Median EBITDA
Margin Improvement²
11%
INVESTMENT
coupang
DiDi
Grab
AutoStore
Full Truck Alliance
ROIVANT
SCIENCES
DOORDASH
symbotic®
sensetime
Paytm
FAIR VALUE ($B) ³
$7.2
$3.1
$2.2
$1.9
$1.1
$0.9
$0.8
$0.7
$0.6
$0.5
TOTAL | $19.1B
NTM CONSENSUS
REVENUE GROWTH4
14%
20%
28%
13%
22%
96%
18%
47%
14%
31%
CURRENT
MARKET CAP ($B) 5
$30.3
$15.6
$13.8
$4.8
$7.5
$9.1
$31.3
$18.8
$6.1
$6.5
Footnotes:
1. Actual year-on-year revenue growth in the last twelve months. Source: CapIQ.
2. Gross margin / EBITDA margin percentage point improvement YTD 2023 (January - June 2023) vs. the same period in 2022. Source: CapIQ.
3. Unrealized fair value by investment as of September 30, 2023. Total figure may differ from the sum of the parts due to rounding.
The information herein is presented solely for SoftBank Vision Fund 1, SoftBank Vision Fund 2 and SoftBank LatAm Funds. These highlights are provided solely for illustrative purposes and individual investors' results may vary. Past performance is not necessarily indicative of future
results. Total Fair Value includes valuations of Unrealized Investments, do not take into account fees or expenses at the time of exit that would reduce the value of returns experienced by investors, and should not be construed as indicative of actual or future performance. Actual Realized
amounts will depend on, among other factors, future operating results, the value of the assets and market conditions at the time of disposition, any related transaction costs and the timing and manner of sale, all of which may differ from the assumptions on which the valuations reported
herein are based. Accordingly, the actual Realized returns on Investments that are Unrealized may differ materially from the values indicated herein. Projected revenue growth presented herein is provided solely for illustrative purposes, reflects the current beliefs of industry analysts and
was prepared by a third party and the Manager makes no representation regarding its accuracy. Peak market cap is shown for illustrative purposes only and SBIA is not implying, and it should not be assumed, that the company will meet or exceed its peak market cap in the future.
4. Analyst consensus growth expectations for the next twelve months. As of September 30, 2023. Source: CapIQ.
5. Market capitalization as of September 30, 2023. Source: CapIQ.
6. Highest historical market capitalization from IPO until September 30, 2023. Source: CapIQ.
35
SUSTAINABLE
FINANCIAL
PERFORMANCE
ΡΕΑΚ
MARKET CAP ($B)6
$86.5
$79.1
$33.7
$18.0
$23.3
$10.3
$84.4
$35.3
$35.0
29
$15.7
SoftBank
Investment AdvisersView entire presentation