Wix Results Presentation Deck
Financial Performance
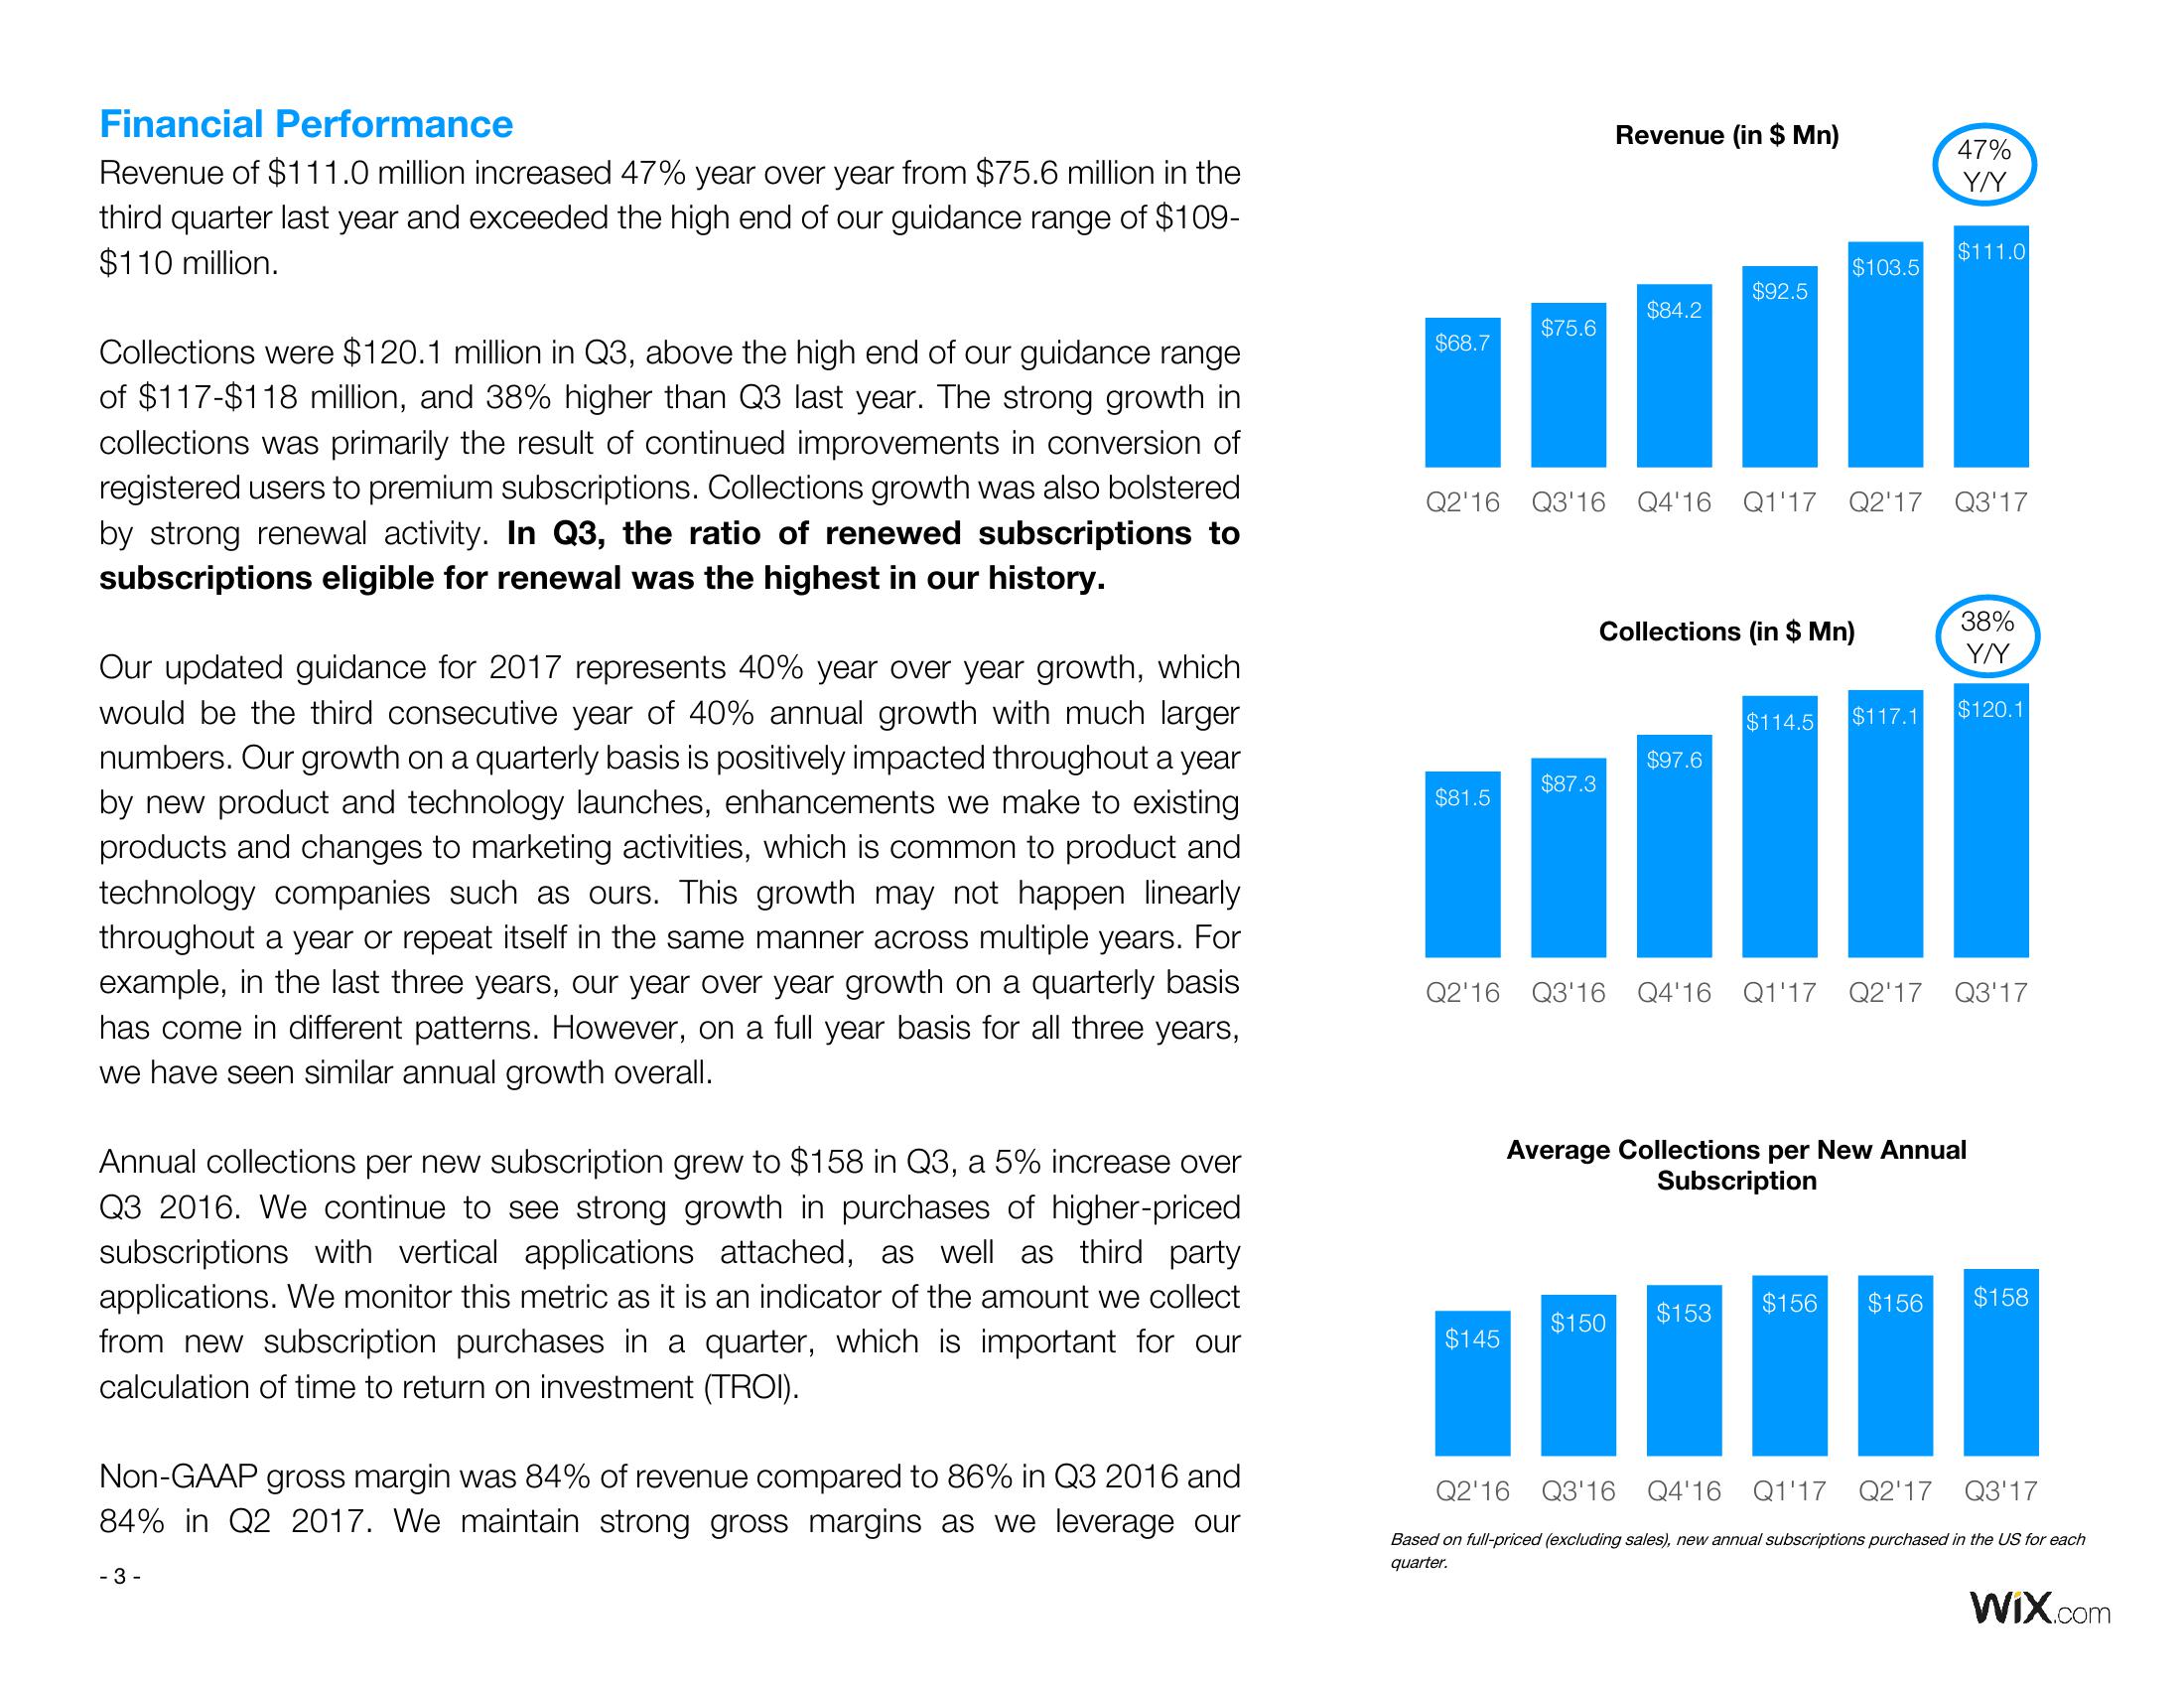
Revenue of $111.0 million increased 47% year over year from $75.6 million in the
third quarter last year and exceeded the high end of our guidance range of $109-
$110 million.
Collections were $120.1 million in Q3, above the high end of our guidance range
of $117-$118 million, and 38% higher than Q3 last year. The strong growth in
collections was primarily the result of continued improvements in conversion of
registered users to premium subscriptions. Collections growth was also bolstered
by strong renewal activity. In Q3, the ratio of renewed subscriptions to
subscriptions eligible for renewal was the highest in our history.
Our updated guidance for 2017 represents 40% year over year growth, which
would be the third consecutive year of 40% annual growth with much larger
numbers. Our growth on a quarterly basis is positively impacted throughout a year
by new product and technology launches, enhancements we make to existing
products and changes to marketing activities, which is common to product and
technology companies such as ours. This growth may not happen linearly
throughout a year or repeat itself in the same manner across multiple years. For
example, in the last three years, our year over year growth on a quarterly basis
has come in different patterns. However, on a full year basis for all three years,
we have seen similar annual growth overall.
Annual collections per new subscription grew to $158 in Q3, a 5% increase over
Q3 2016. We continue to see strong growth in purchases of higher-priced
subscriptions with vertical applications attached, as well as third party
applications. We monitor this metric as it is an indicator of the amount we collect
from new subscription purchases in a quarter, which is important for our
calculation of time to return on investment (TROI).
Non-GAAP gross margin was 84% of revenue compared to 86% in Q3 2016 and
84% in Q2 2017. We maintain strong gross margins as we leverage our
- 3-
$68.7
$81.5
$75.6
$145
$87.3
Revenue (in $ Mn)
Q2'16 Q3'16 Q4'16 Q1'17 Q2'17
$84.2
$150
$92.5
$97.6
Collections (in $ Mn)
$103.5
$153
47%
Y/Y
Q2'16 Q3'16 Q4'16 Q1'17 Q2'17 Q3'17
$111.0
38%
Y/Y
$114.5 $117.1 $120.1
$156
Q3'17
Average Collections per New Annual
Subscription
$156 $158
Q2'16 Q3'16 Q4'16 Q1'17 Q2'17 Q3'17
Based on full-priced (excluding sales), new annual subscriptions purchased in the US for each
quarter.
WIX.comView entire presentation