Commercial Metals Company Results Presentation Deck
Rebar Consumption by End Market (% of 2021 Total)
Long-Term Outlook Supported by Powerful Structural Trends
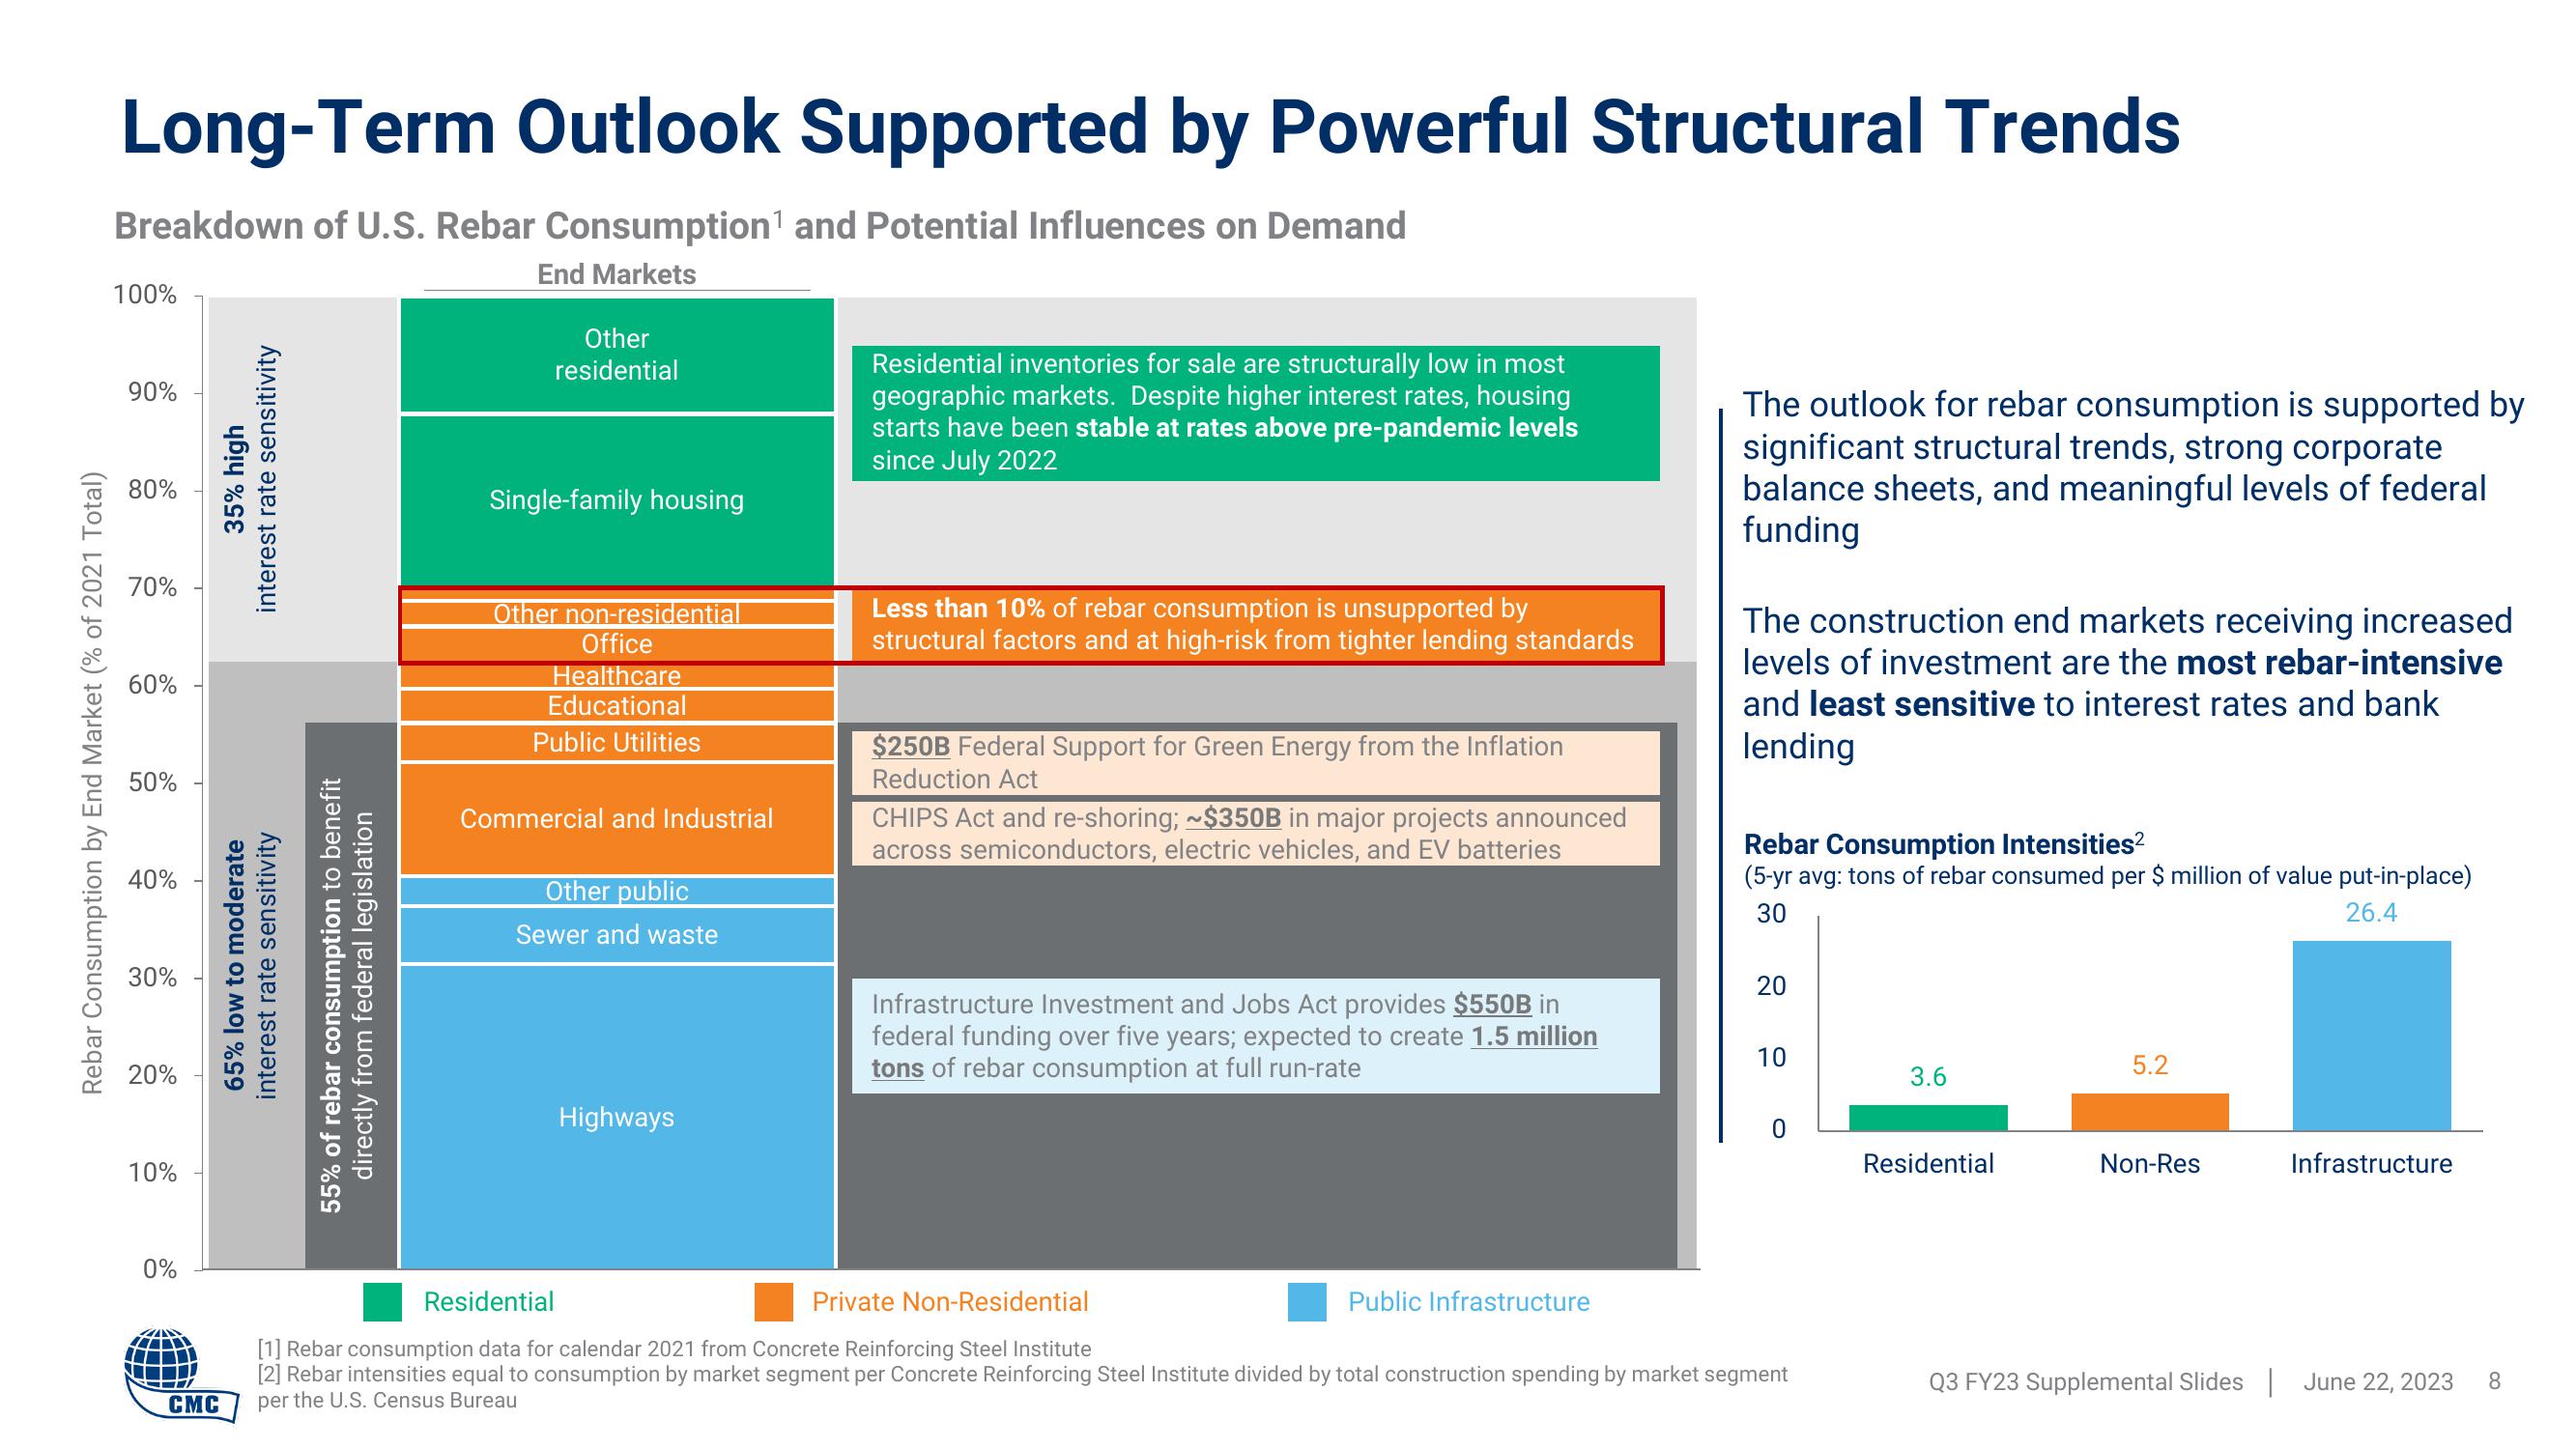
Breakdown of U.S. Rebar Consumption¹ and Potential Influences on Demand
End Markets
100%
90%
80%
70%
60%
50%
40%
30%
20%
10%
0%
T
CMC
35% high
interest rate sensitivity
65% low to moderate
interest rate sensitivity
55% of rebar consumption to benefit
directly from federal legislation
Other
residential
Single-family housing
Other non-residential
Office
Healthcare
Educational
Public Utilities
Commercial and Industrial
Other public
Sewer and waste
Highways
Residential inventories for sale are structurally low in most
geographic markets. Despite higher interest rates, housing
starts have been stable at rates above pre-pandemic levels
since July 2022
Less than 10% of rebar consumption is unsupported by
structural factors and at high-risk from tighter lending standards
$250B Federal Support for Green Energy from the Inflation
Reduction Act
CHIPS Act and re-shoring; ~$350B in major projects announced
across semiconductors, electric vehicles, and EV batteries
Infrastructure Investment and Jobs Act provides $550B in
federal funding over five years; expected to create 1.5 million
tons of rebar consumption at full run-rate
Public Infrastructure
The outlook for rebar consumption is supported by
significant structural trends, strong corporate
balance sheets, and meaningful levels of federal
funding
The construction end markets receiving increased
levels of investment are the most rebar-intensive
and least sensitive to interest rates and bank
lending
Rebar Consumption Intensities²
(5-yr avg: tons of rebar consumed per $ million of value put-in-place)
30
26.4
20
10
0
Residential
Private Non-Residential
[1] Rebar consumption data for calendar 2021 from Concrete Reinforcing Steel Institute
[2] Rebar intensities equal to consumption by market segment per Concrete Reinforcing Steel Institute divided by total construction spending by market segment
per the U.S. Census Bureau
3.6
Residential
5.2
Non-Res
Infrastructure
Q3 FY23 Supplemental Slides June 22, 2023
8View entire presentation