Investor Presentation
Economics and Demand Driving the Addressable Market
Solar Economics
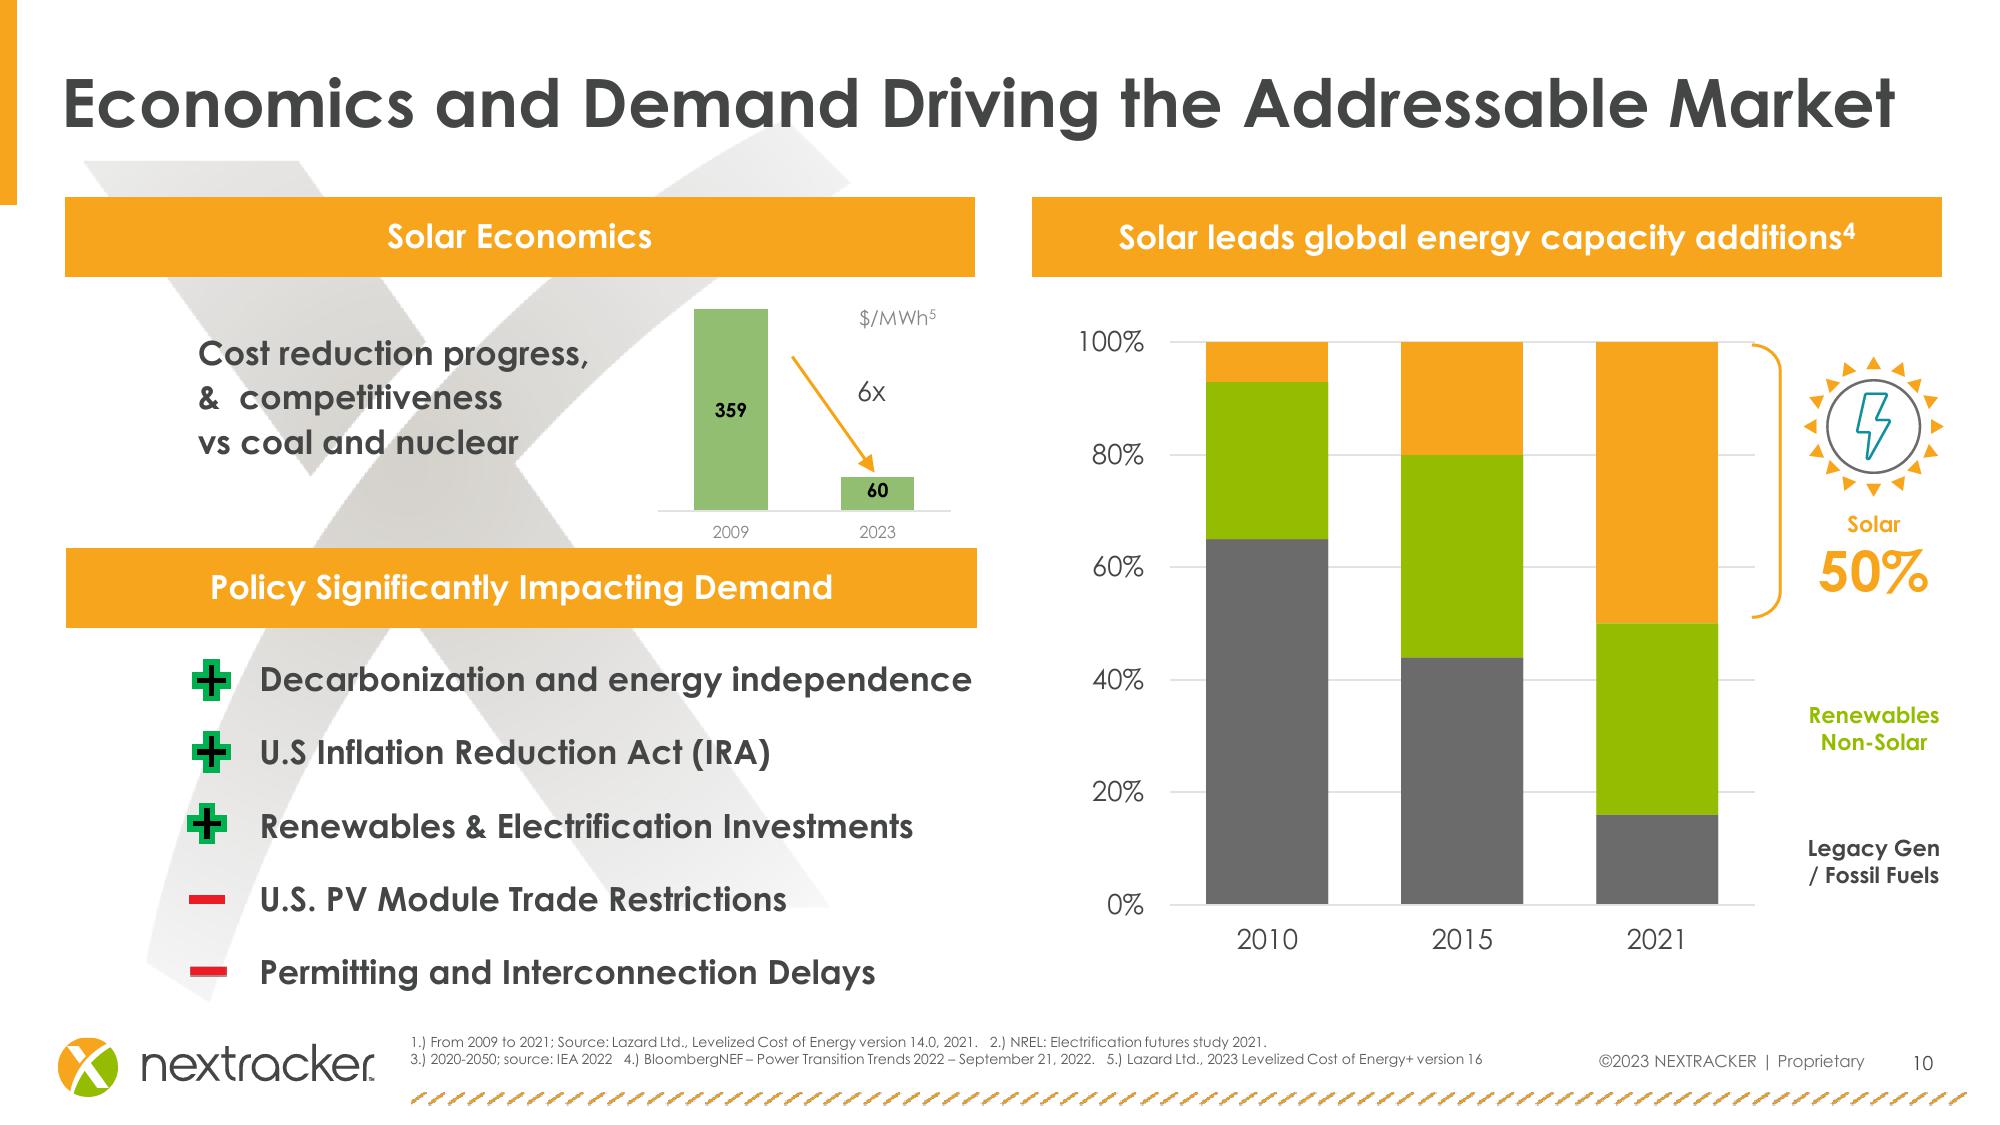
Solar leads global energy capacity additions4
Cost reduction progress,
& competitiveness
vs coal and nuclear
$/MWh5
100%
6x
359
80%
60
2009
2023
60%
Policy Significantly Impacting Demand
Solar
50%
Decarbonization and energy independence
40%
Renewables
Non-Solar
+ U.S Inflation Reduction Act (IRA)
20%
+ Renewables & Electrification Investments
Legacy Gen
/ Fossil Fuels
-
U.S. PV Module Trade Restrictions
0%
2010
2015
2021
Permitting and Interconnection Delays
nextracker. 3.) 2020-2050; source: IEA 2022 4.) BloombergNEF-Power Transition Trends 2022-September 21, 2022. 5.) Lazard Ltd., 2023 Levelized Cost of Energy+ version 16
1.) From 2009 to 2021; Source: Lazard Ltd., Levelized Cost of Energy version 14.0, 2021. 2.) NREL: Electrification futures study 2021.
©2023 NEXTRACKER | Proprietary
10View entire presentation