Long Duration Energy Storage Systems for a Cleaner Future
12
Stabilize the Grid and Accelerate Renewables
GW
RESSI
INC
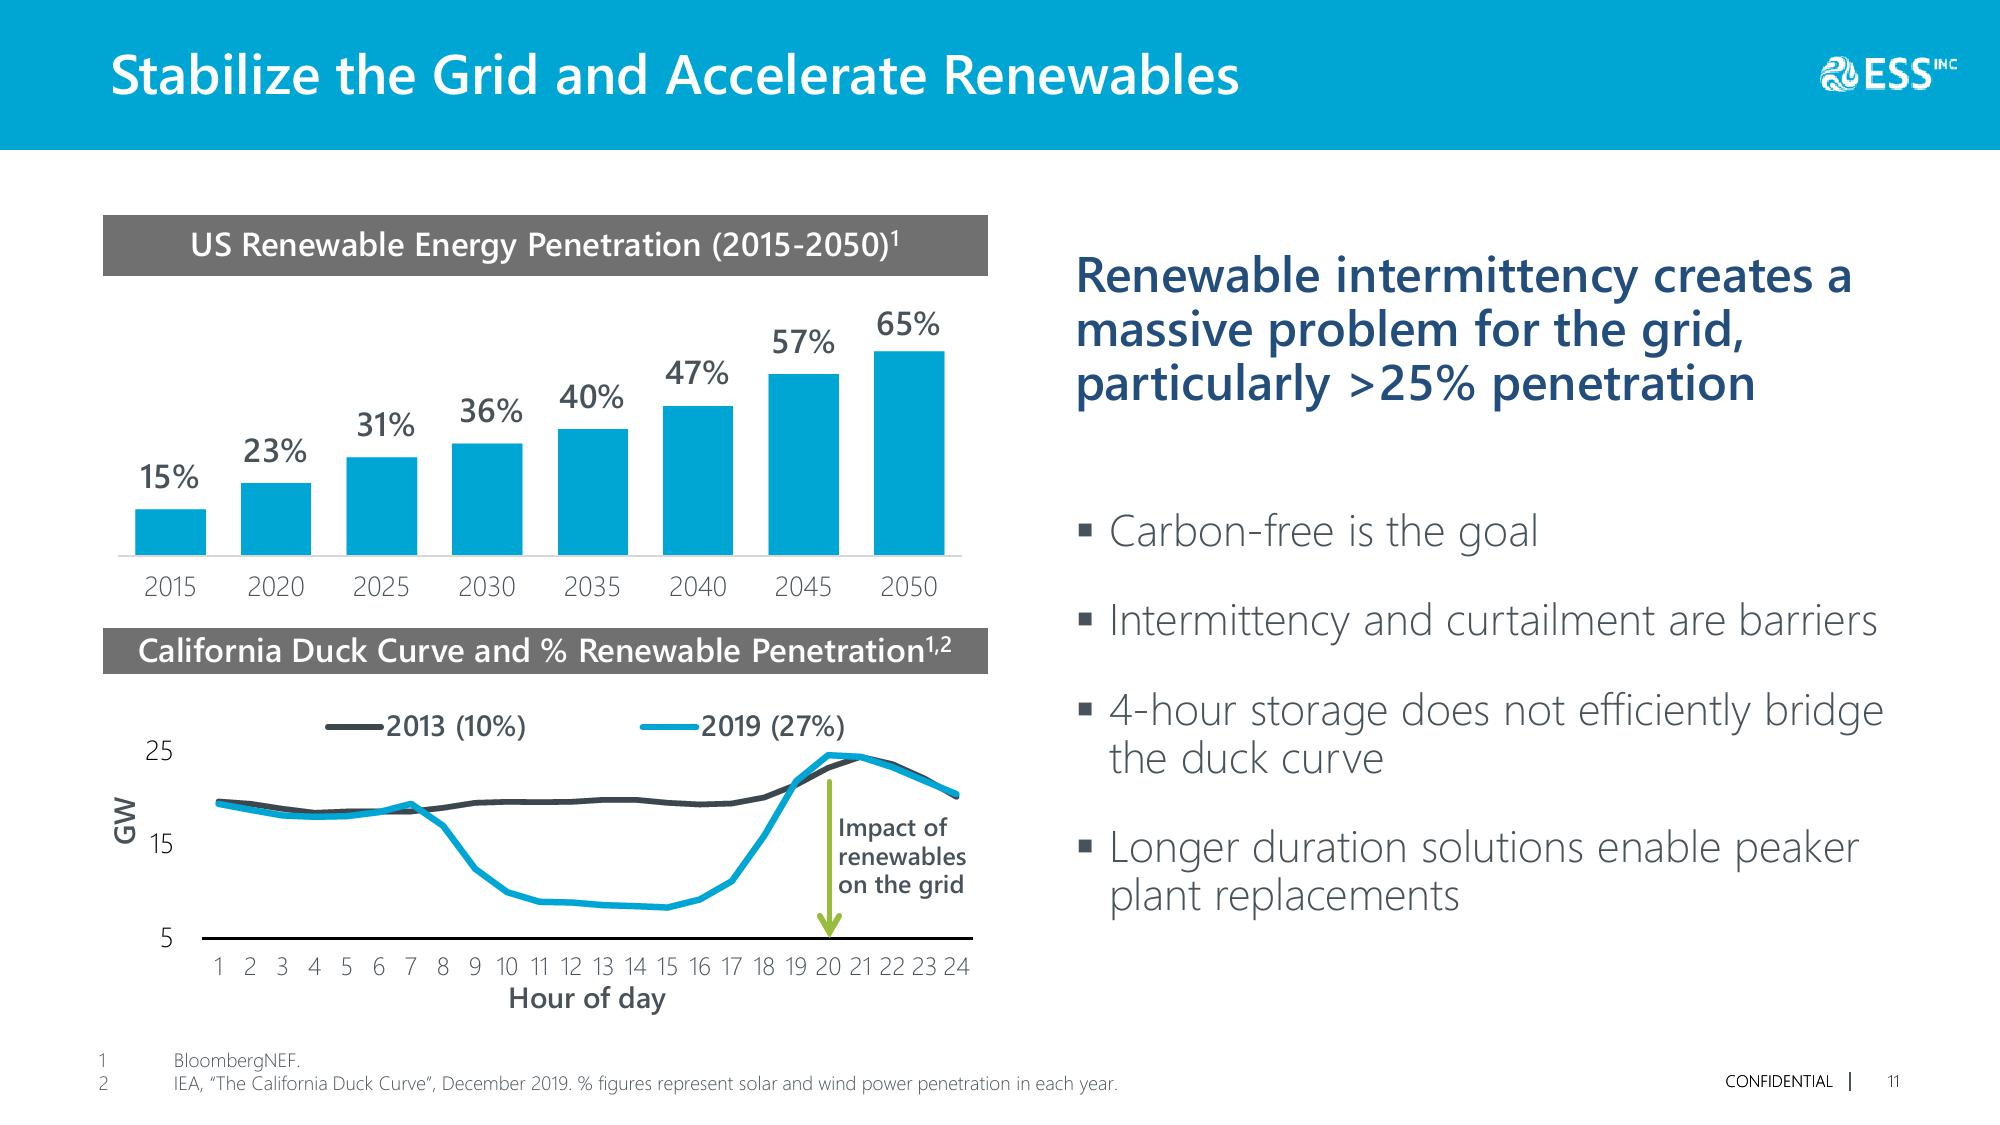
US Renewable Energy Penetration (2015-2050)1
65%
57%
47%
40%
36%
31%
23%
15%
2015 2020 2025 2030 2035 2040 2045 2050
California Duck Curve and % Renewable Penetration1,2
25
15
5
-2013 (10%)
-2019 (27%)
Impact of
renewables
on the grid
1 2 3 4 5 6 7 8 9 10 11 12 13 14 15 16 17 18 19 20 21 22 23 24
Renewable intermittency creates a
massive problem for the grid,
particularly >25% penetration
Carbon-free is the goal
Intermittency and curtailment are barriers
■4-hour storage does not efficiently bridge.
the duck curve
Longer duration solutions enable peaker
plant replacements
Hour of day
BloombergNEF.
IEA, "The California Duck Curve", December 2019. % figures represent solar and wind power penetration in each year.
CONFIDENTIAL| 11View entire presentation