flyExclusive SPAC
V. FINANCIAL OVERVIEW
IMPACT OF STRATEGIC REFURBISHMENT INVESTMENT
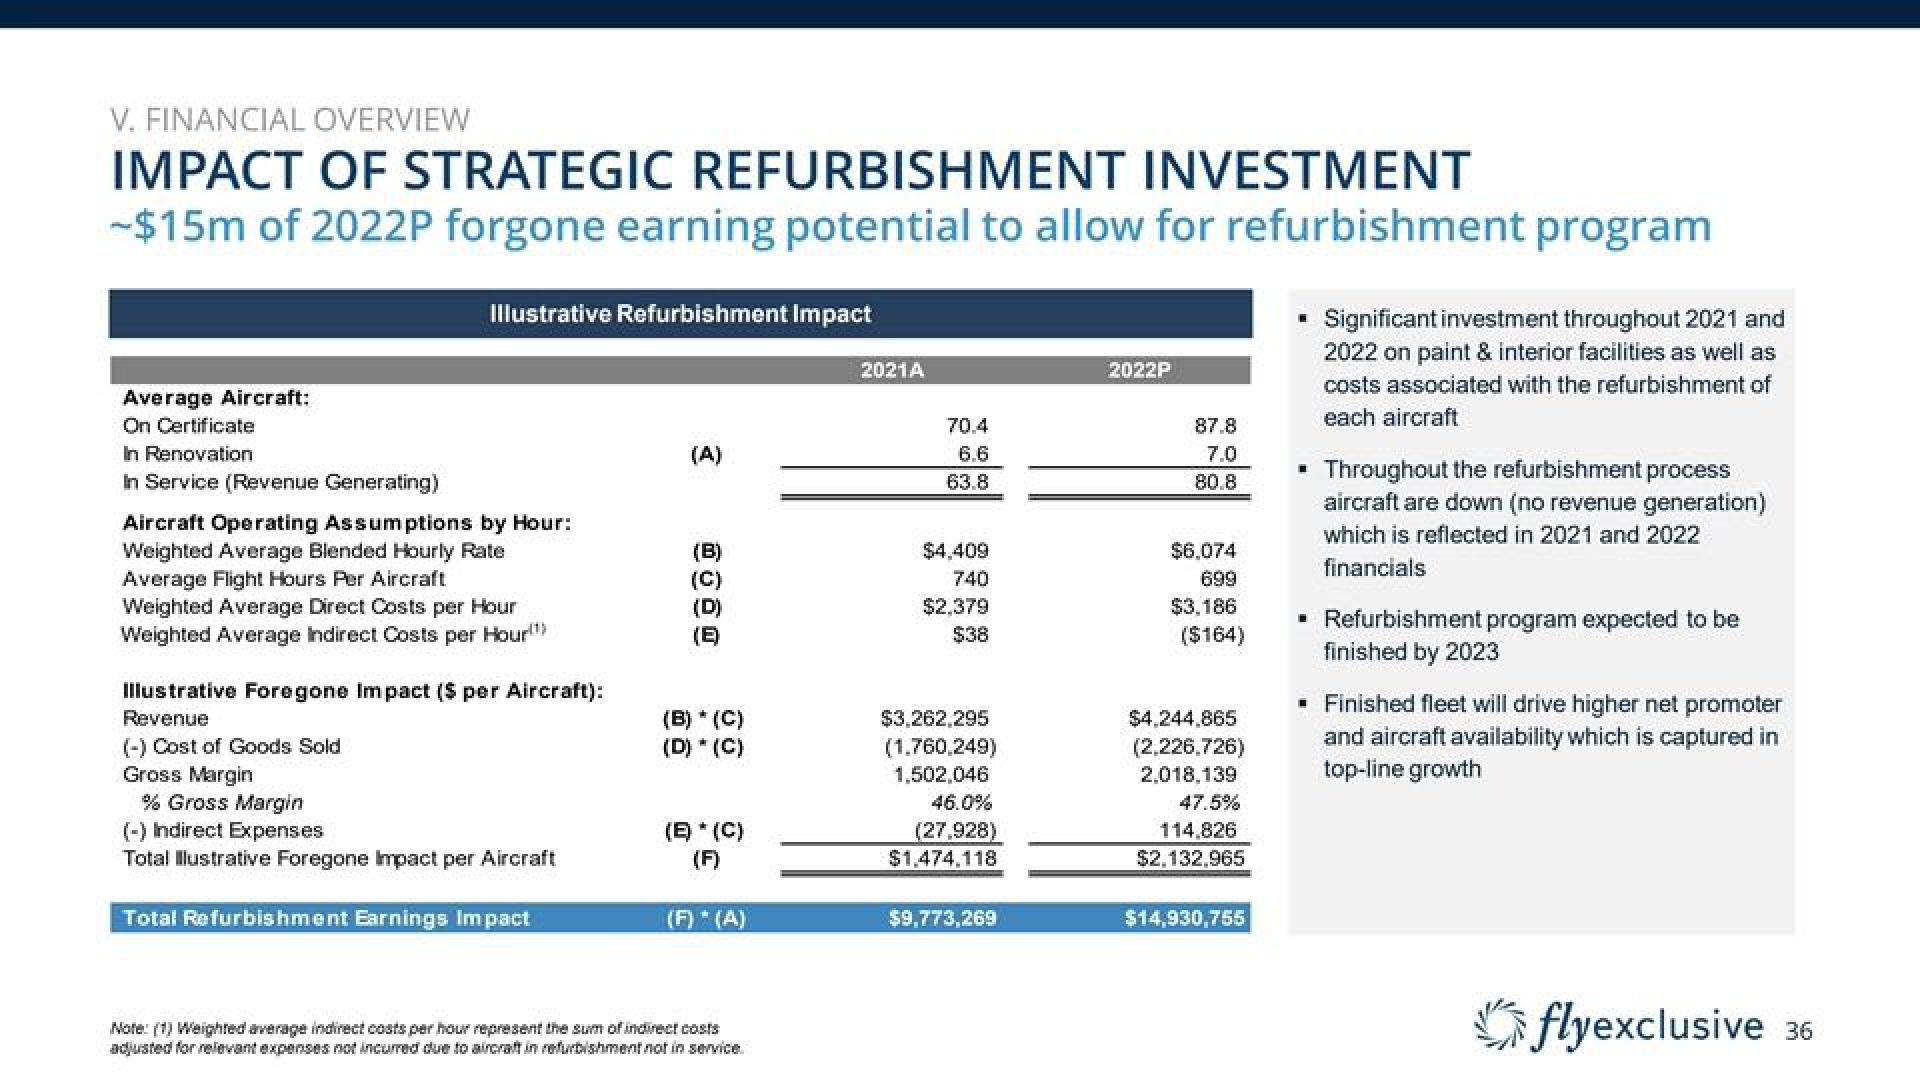
-$15m of 2022P forgone earning potential to allow for refurbishment program
Average Aircraft:
On Certificate
In Renovation
In Service (Revenue Generating)
Illustrative Refurbishment Impact
Aircraft Operating Assumptions by Hour:
Weighted Average Blended Hourly Rate.
Average Flight Hours Per Aircraft
Weighted Average Direct Costs per Hour
Weighted Average Indirect Costs per Hour)
Illustrative Foregone Impact ($ per Aircraft):
Revenue
(-) Cost of Goods Sold
Gross Margin
% Gross Margin
(-) Indirect Expenses
Total Illustrative Foregone Impact per Aircraft
Total Refurbishment Earnings Impact
(A)
(B)
(D)
(B) * (C)
(D) * (C)
(E) * (C)
(F)
(F) * (A)
Note: (1) Weighted average indirect costs per hour represent the sum of indirect costs
adjusted for relevant expenses not incurred due to aircraft in refurbishment not in service.
2021A
70.4
6.6
63.8
$4,409
740
$2.379
$38
$3,262,295
(1.760,249)
1,502,046
46.0%
(27,928)
$1,474,118
$9,773,269
2022P
87.8
7.0
80.8
$6,074
699
$3,186
($164)
$4,244,865
(2,226,726)
2,018,139
47.5%
114,826
$2,132,965
$14,930,755
■
Significant investment throughout 2021 and
2022 on paint & interior facilities as well as
costs associated with the refurbishment of
each aircraft
▪ Throughout the refurbishment process
aircraft are down (no revenue generation)
which is reflected in 2021 and 2022
financials
■ Refurbishment program expected to be
finished by 2023
■ Finished fleet will drive higher net promoter
and aircraft availability which is captured in
top-line growth
flyexclusive 36View entire presentation