First Foundation Investor Presentation Deck
Loan Portfolio Overview
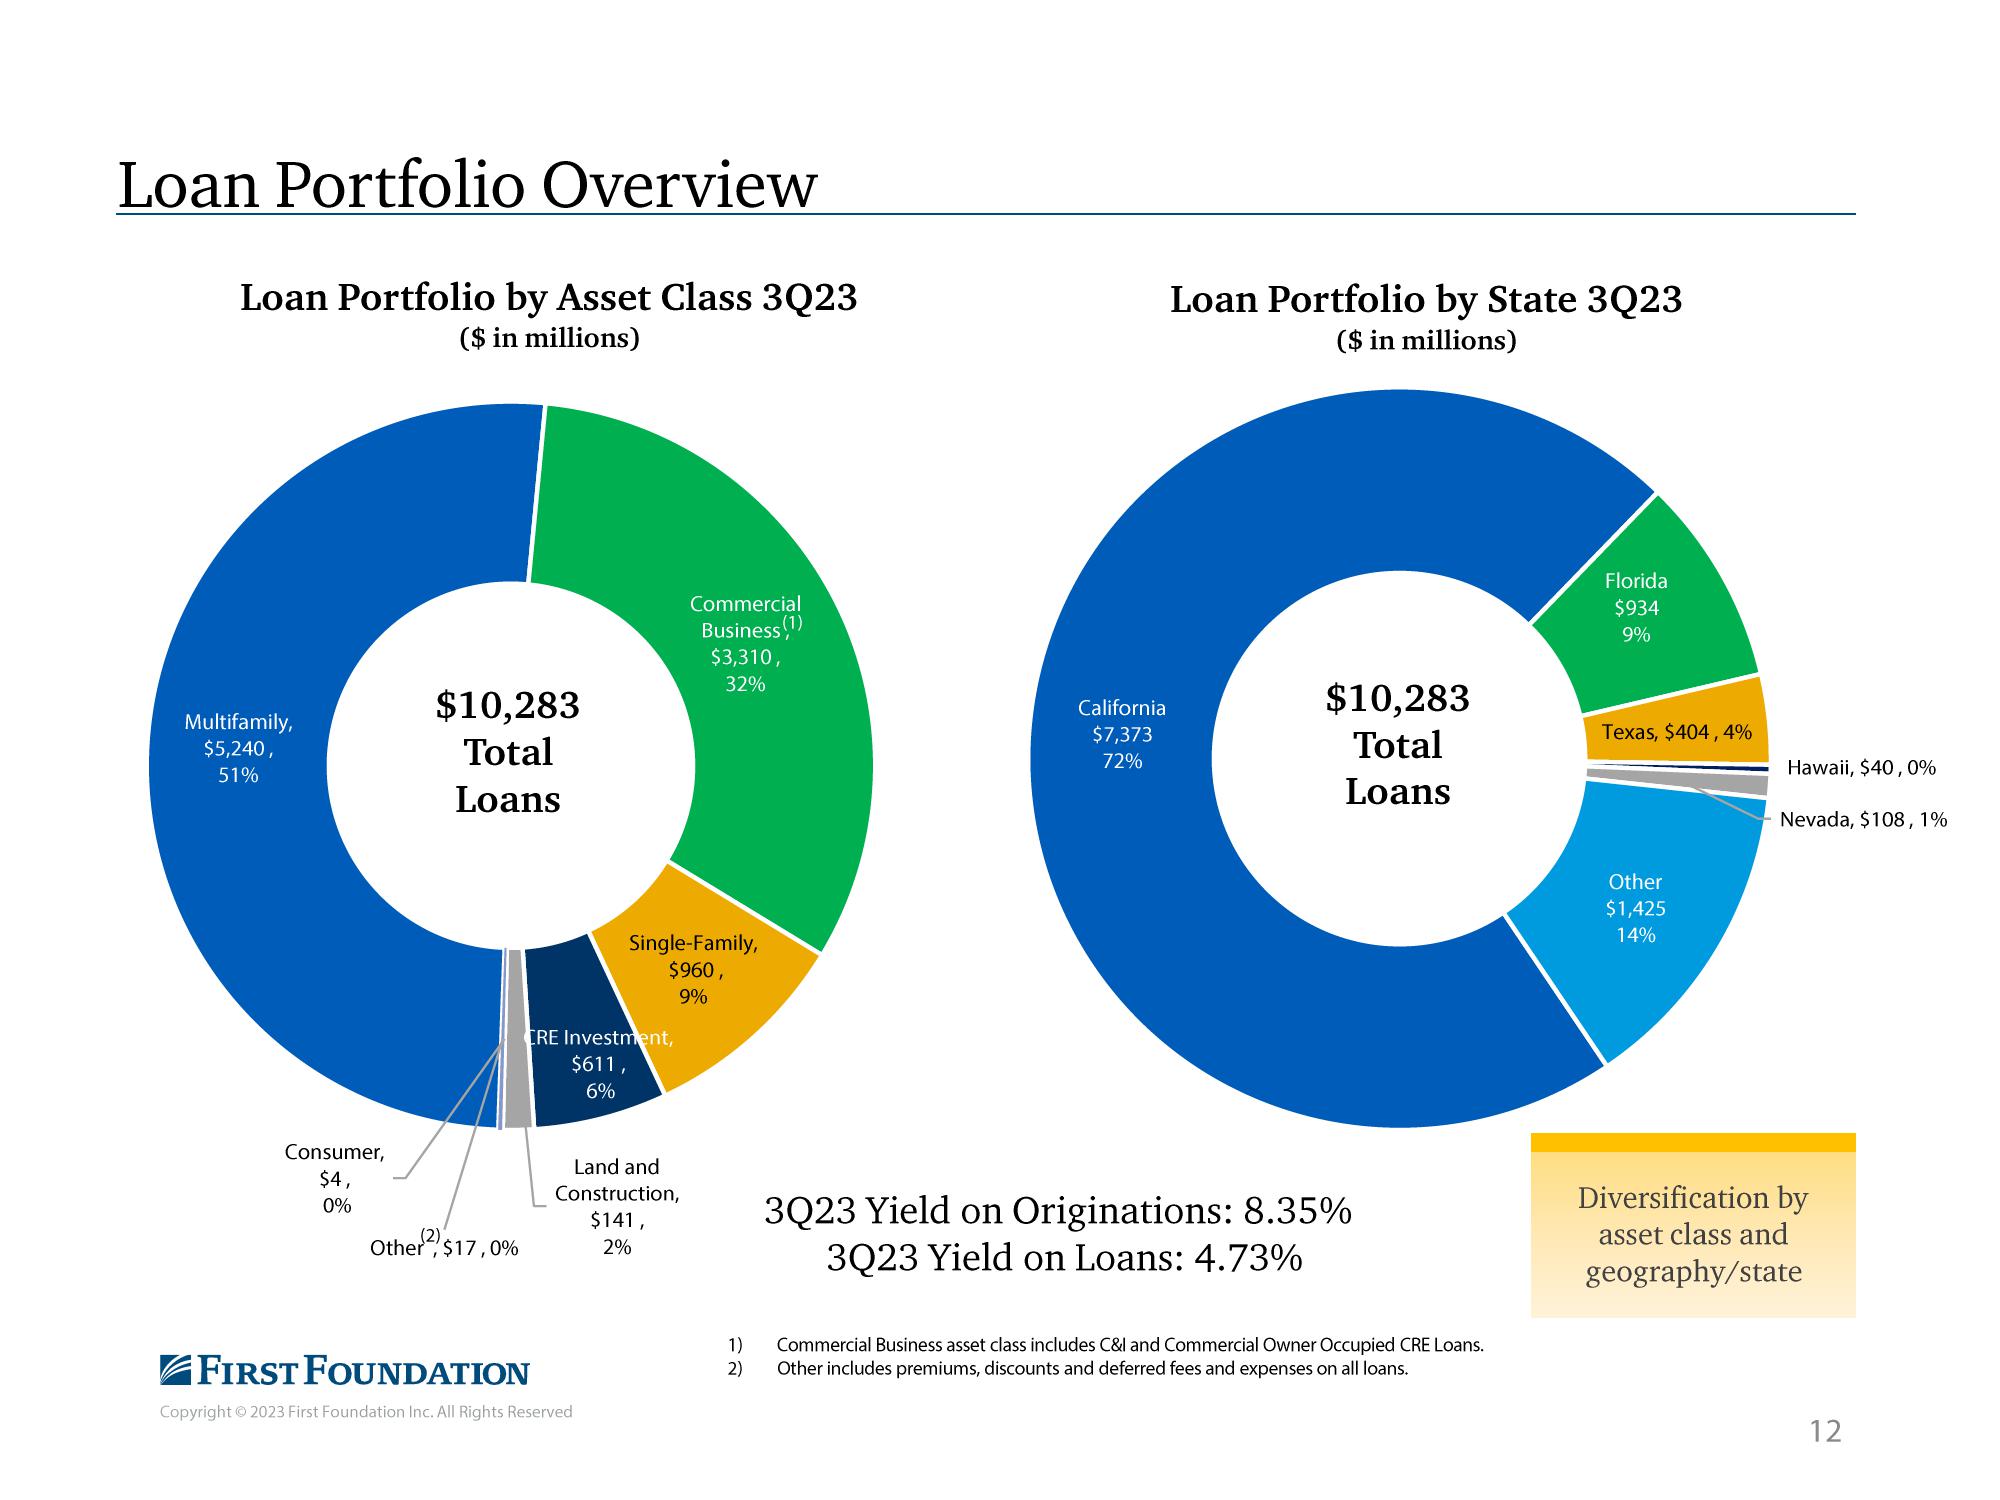
Loan Portfolio by Asset Class 3Q23
($ in millions)
Multifamily,
$5,240,
51%
Consumer,
$4,
0%
$10,283
Total
Loans
Other $17,0%
CRE Investment,
$611,
6%
Single-Family,
$960,
9%
Land and
Construction,
$141,
2%
FIRST FOUNDATION
Copyright © 2023 First Foundation Inc. All Rights Reserved
Commercial
Business (1)
$3,310,
32%
1)
2)
California
$7,373
72%
Loan Portfolio by State 3Q23
($ in millions)
$10,283
Total
Loans
3Q23 Yield on Originations: 8.35%
3Q23 Yield on Loans: 4.73%
Commercial Business asset class includes C&l and Commercial Owner Occupied CRE Loans.
Other includes premiums, discounts and deferred fees and expenses on all loans.
Florida
$934
9%
Texas, $404,4%
Other
$1,425
14%
Hawaii, $40, 0%
Nevada, $108, 1%
Diversification by
asset class and
geography/state
12View entire presentation