Sprinklr Investor Presentation Deck
Sprinklr at a glance
Note:
1)
2)
3)
4)
4
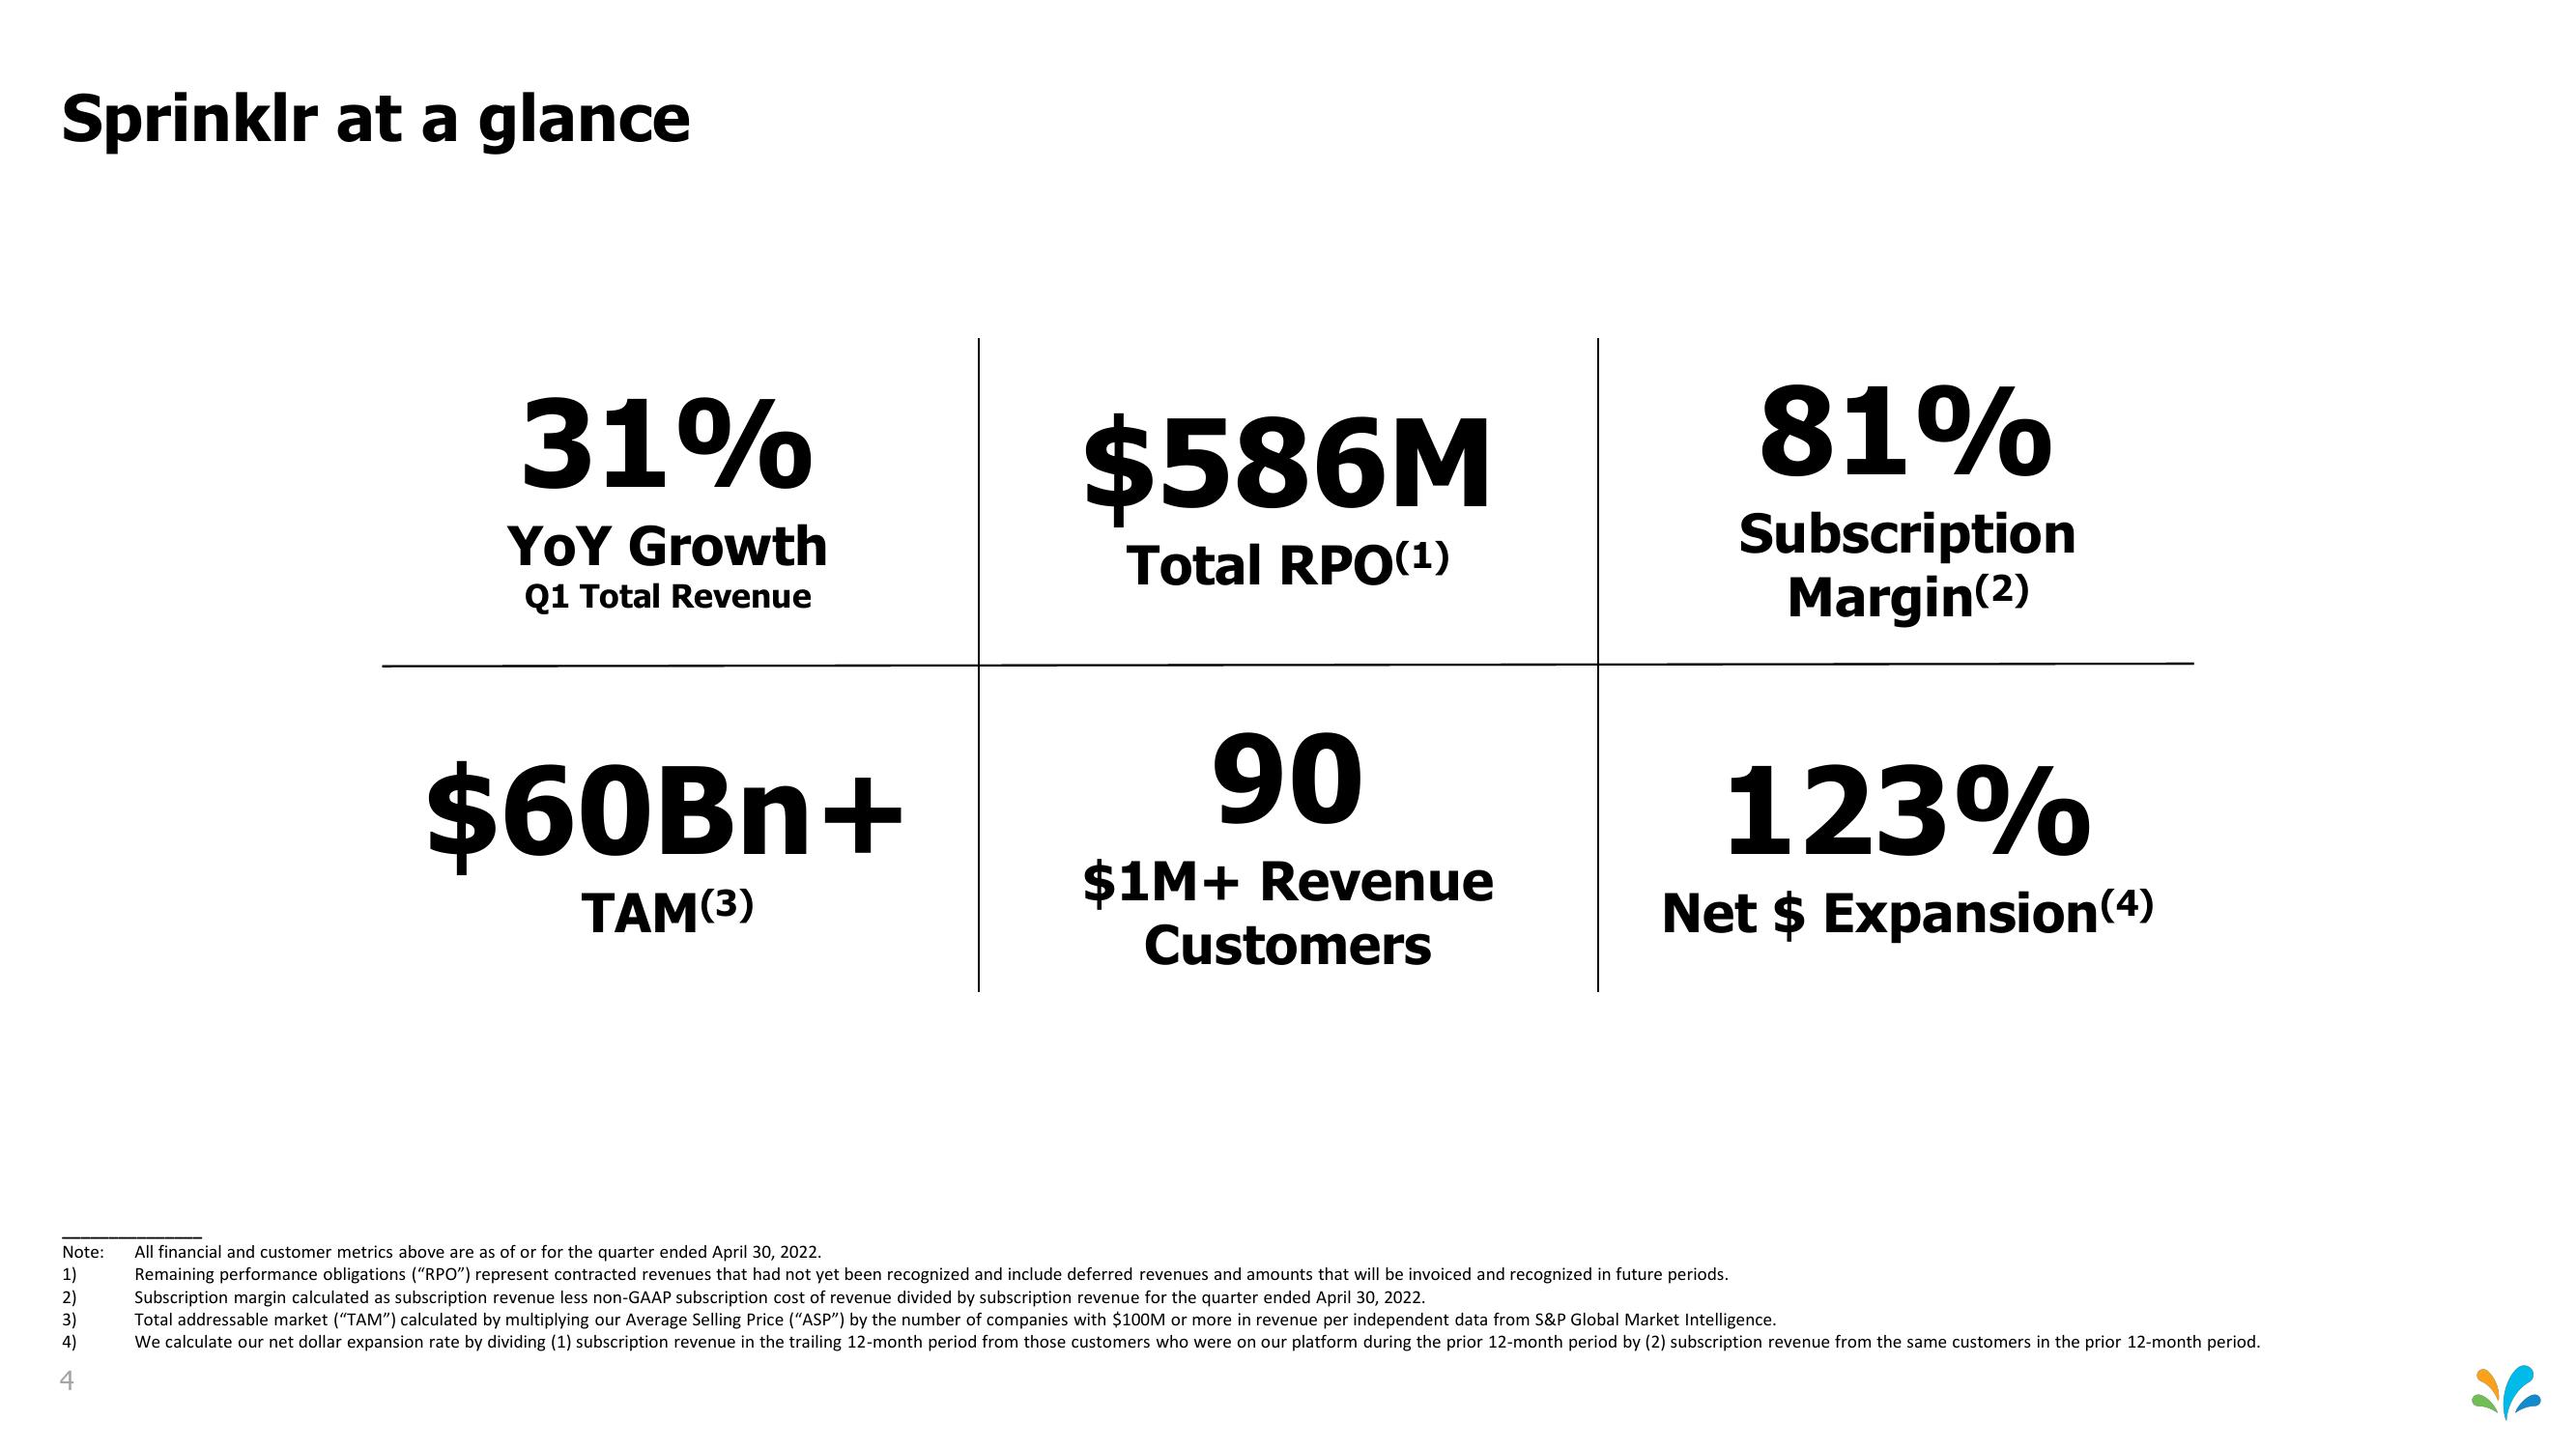
31%
YOY Growth
Q1 Total Revenue
$60Bn+
TAM(3)
$586M
Total RPO(¹)
90
$1M+ Revenue
Customers
81%
Subscription
Margin(2)
123%
Net $ Expansion (4)
All financial and customer metrics above are as of or for the quarter ended April 30, 2022.
Remaining performance obligations ("RPO") represent contracted revenues that had not yet been recognized and include deferred revenues and amounts that will be invoiced and recognized in future periods.
Subscription margin calculated as subscription revenue less non-GAAP subscription cost of revenue divided by subscription revenue for the quarter ended April 30, 2022.
Total addressable market ("TAM") calculated by multiplying our Average Selling Price ("ASP") by the number of companies with $100M or more in revenue per independent data from S&P Global Market Intelligence.
We calculate our net dollar expansion rate by dividing (1) subscription revenue in the trailing 12-month period from those customers who were on our platform during the prior 12-month period by (2) subscription revenue from the same customers in the prior 12-month period.View entire presentation