Nexters Results Presentation Deck
Key financial highlights (2/2)
$m
Selling and Marketing Expenses
6
65
Q1 2021
-13%
Source: Company information
57
Q1 2022
$m
G&A Expenses
3
Q1 2021
>100%
80
Q1 2022
$m
Total Costs and Expenses,
Excluding D&A
96
Q1 2021
+12%
108
Q1 2022
nexters
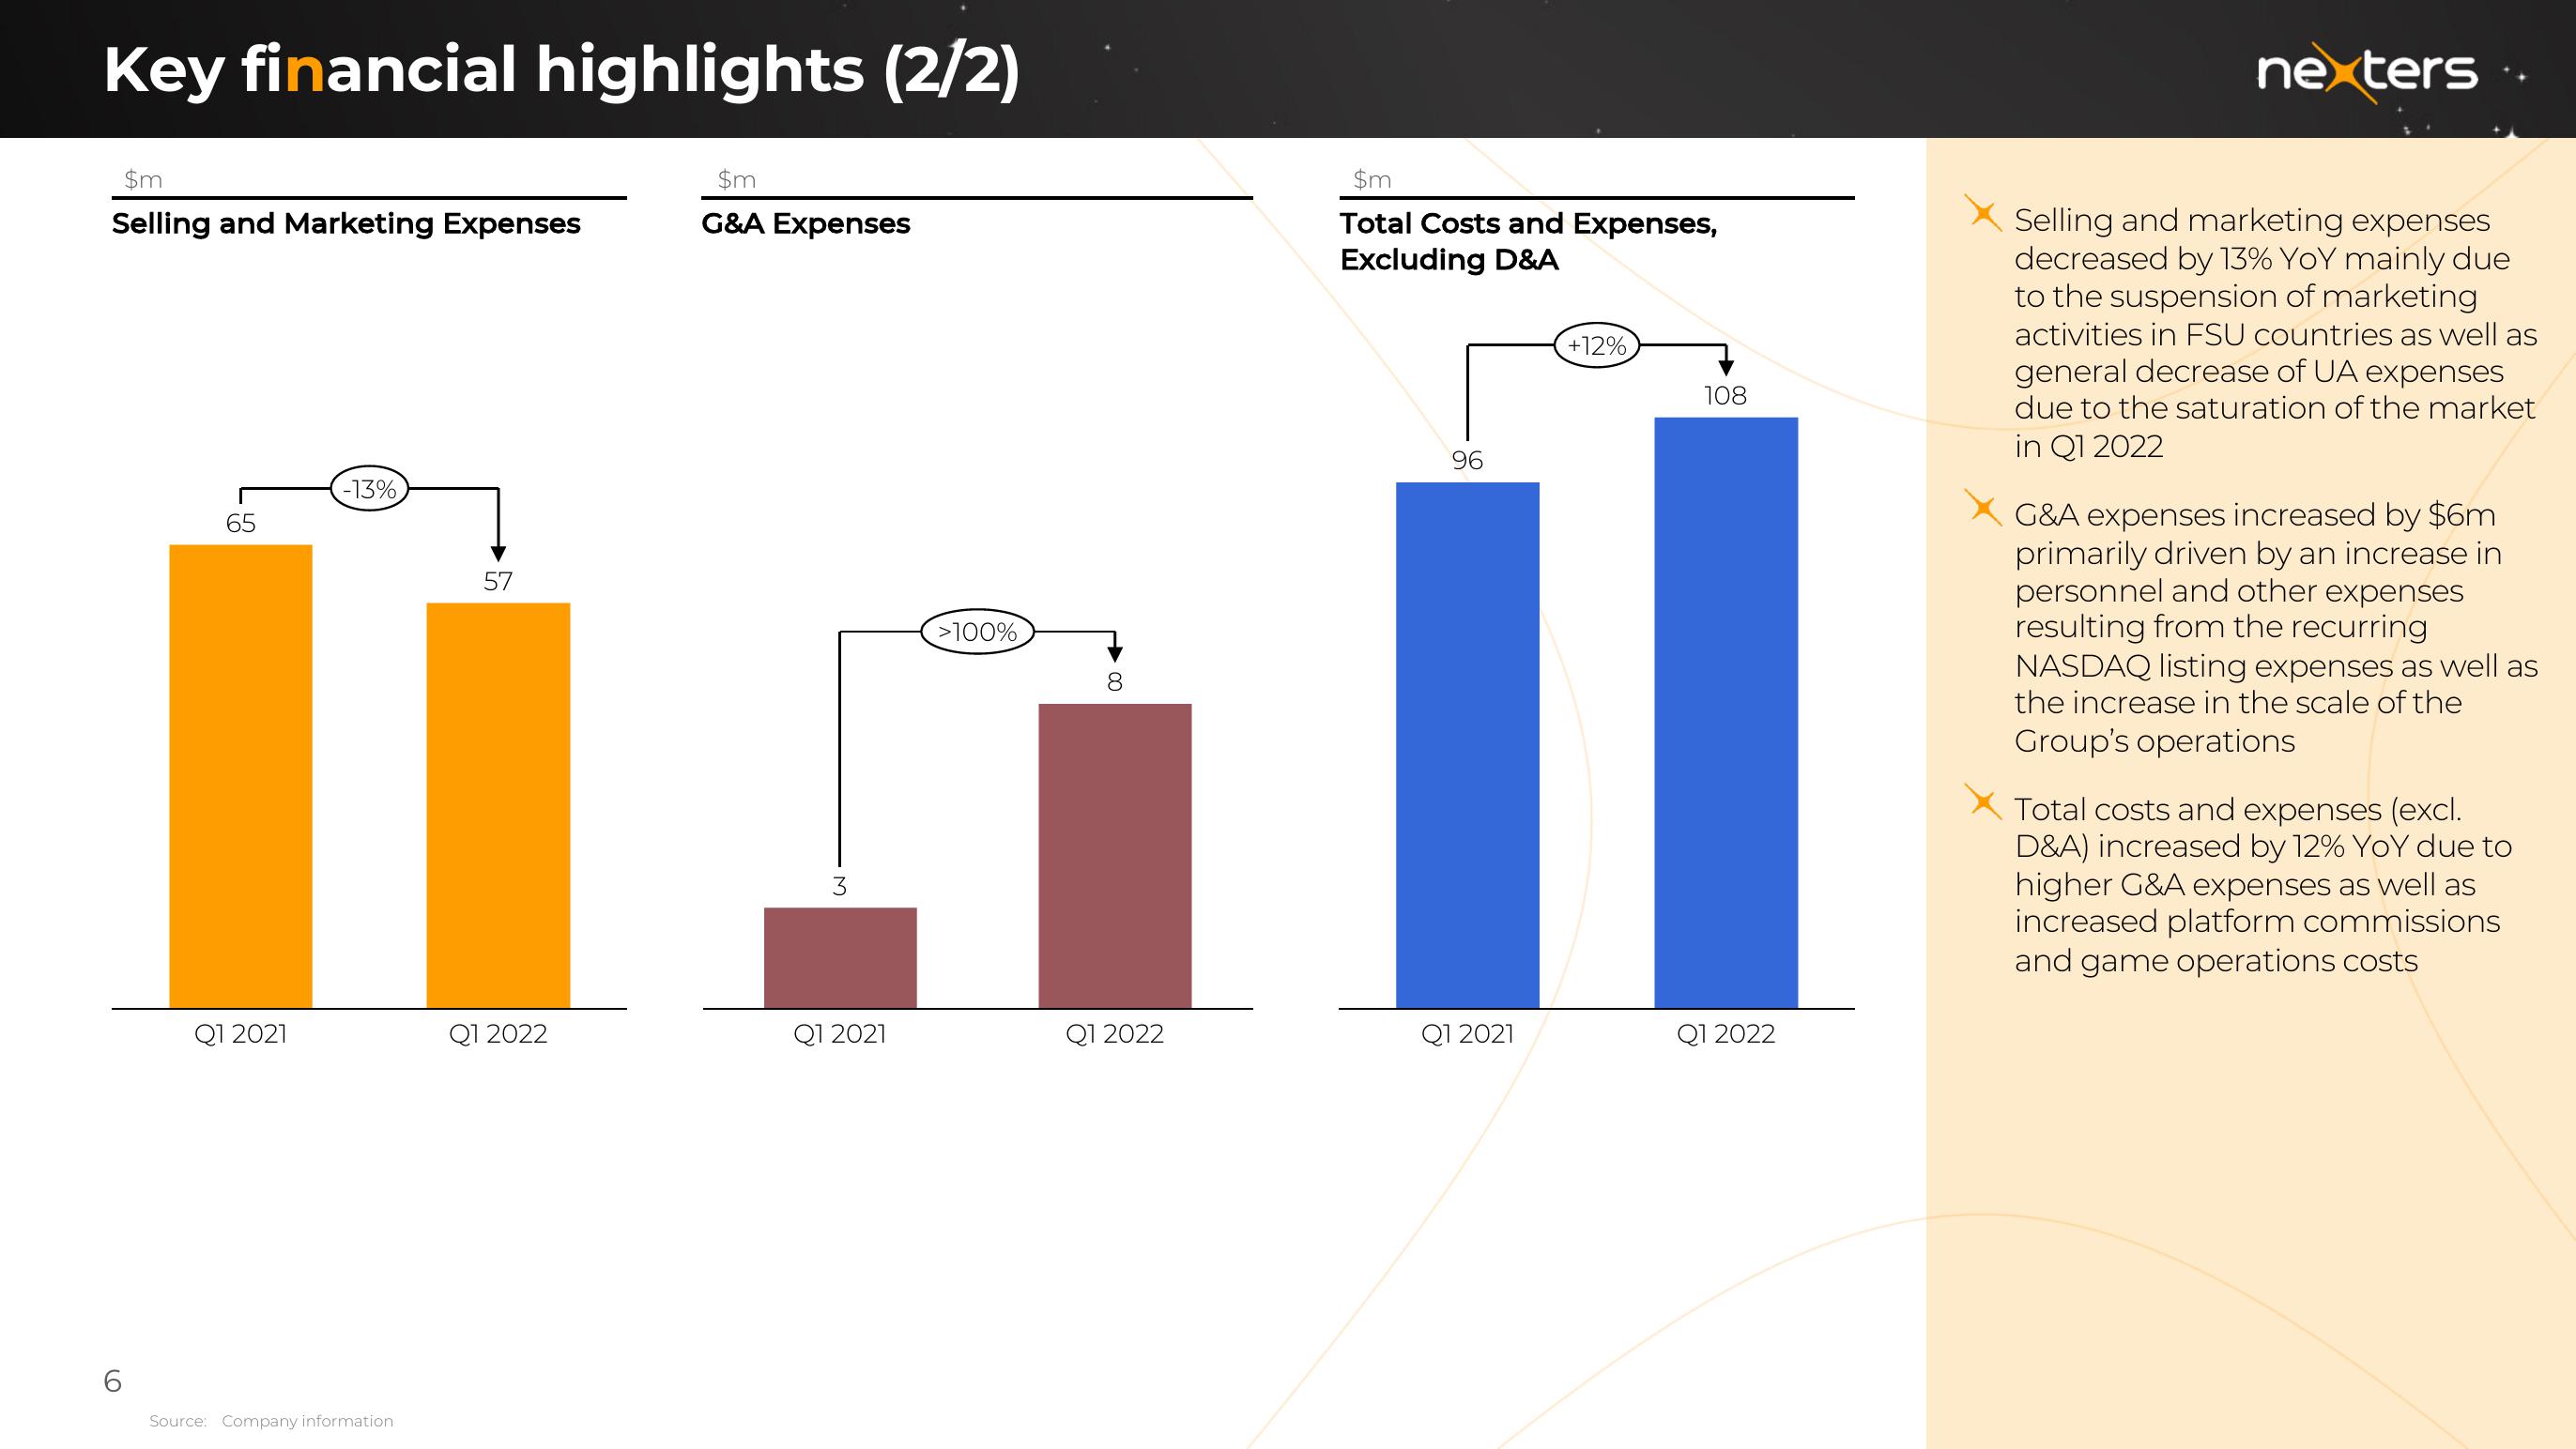
Selling and marketing expenses
decreased by 13% YoY mainly due
to the suspension of marketing
activities in FSU countries as well as
general decrease of UA expenses
due to the saturation of the market
in Q1 2022
G&A expenses increased by $6m
primarily driven by an increase in
personnel and other expenses
resulting from the recurring
NASDAQ listing expenses as well as
the increase in the scale of the
Group's operations
Total costs and expenses (excl.
D&A) increased by 12% YoY due to
higher G&A expenses as well as
increased platform commissions
and game operations costsView entire presentation