Zegna Results Presentation Deck
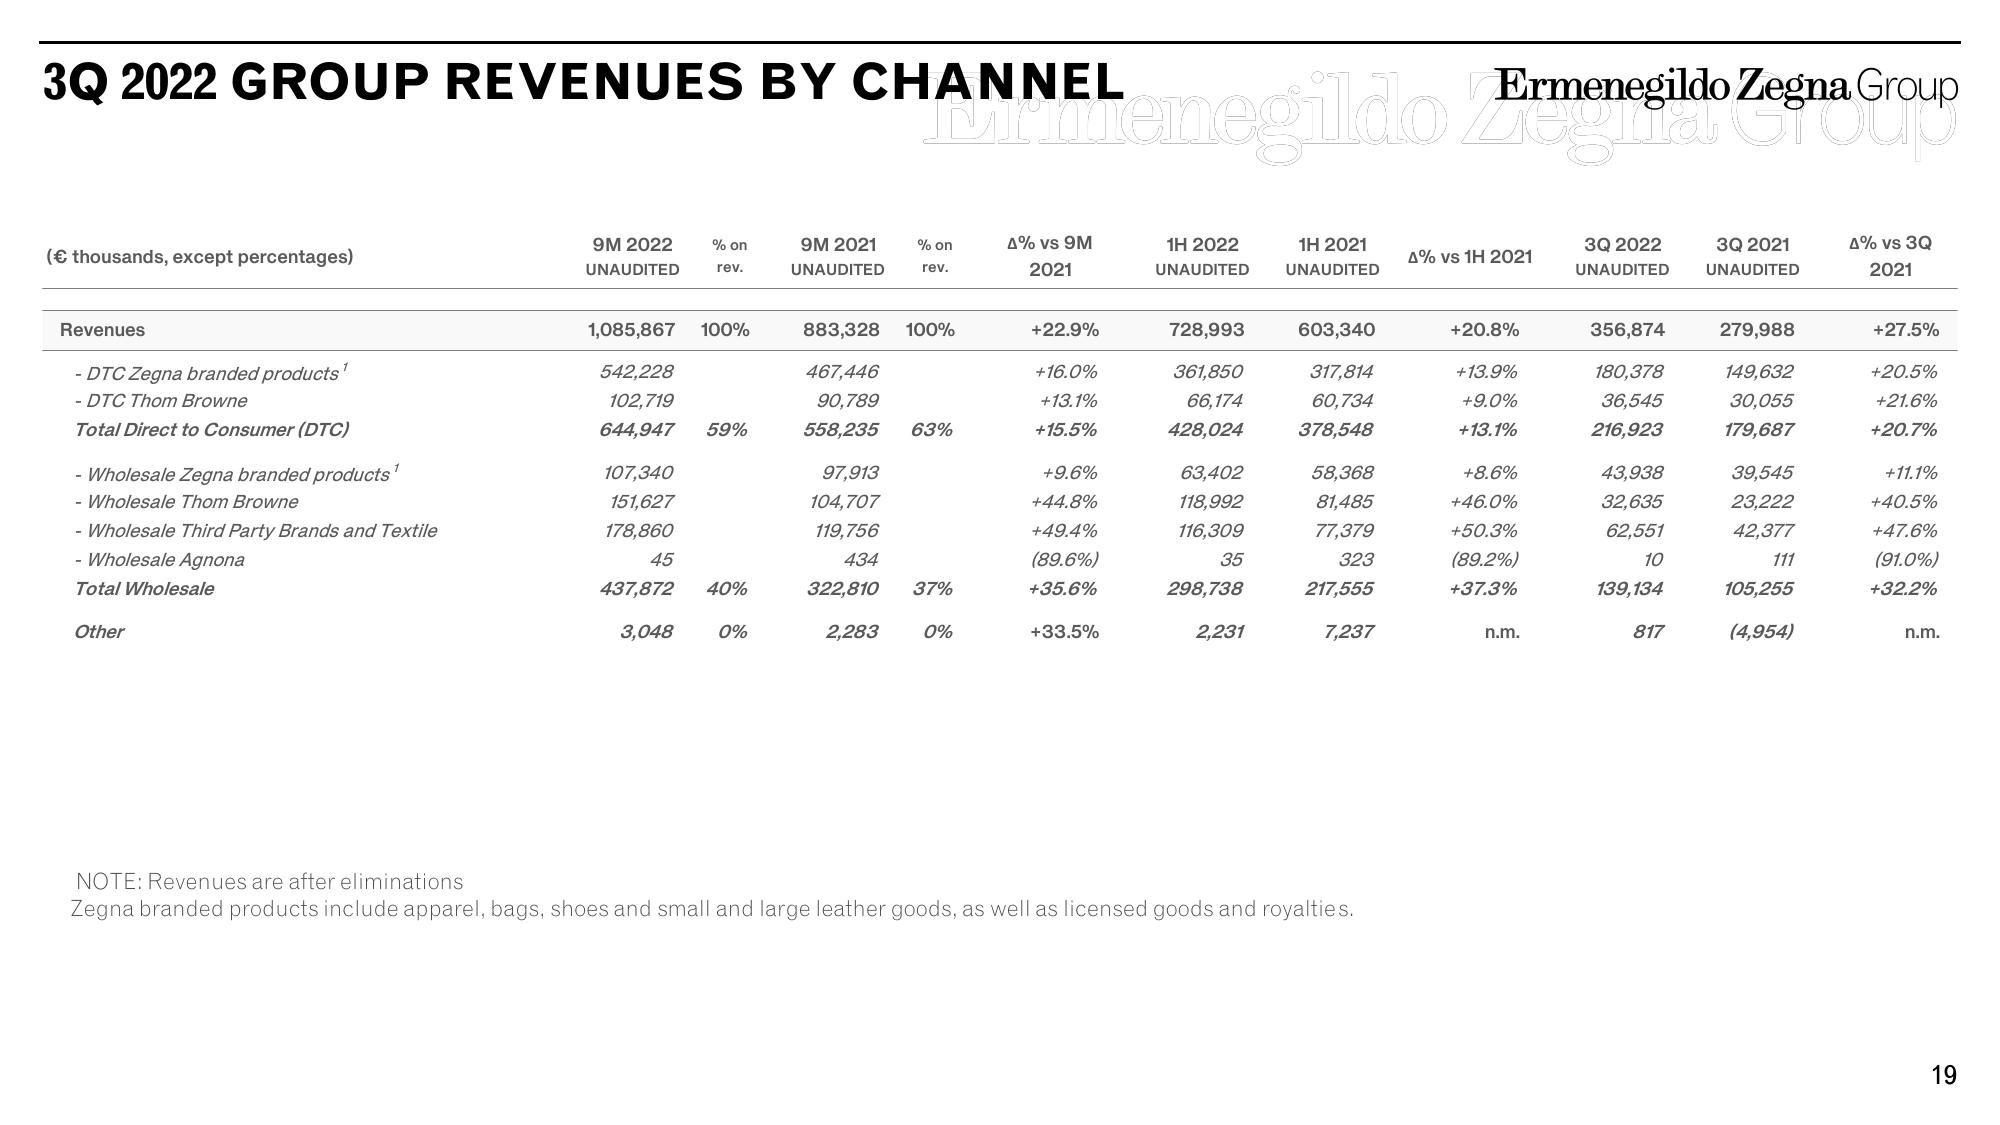
3Q 2022 GROUP REVENUES BY CHANNEL
(€ thousands, except percentages)
Revenues
- DTC Zegna branded products¹
- DTC Thom Browne
Total Direct to Consumer (DTC)
- Wholesale Zegna branded products ¹
- Wholesale Thom Browne
- Wholesale Third Party Brands and Textile
- Wholesale Agnona
Total Wholesale
Other
9M 2022
UNAUDITED
1,085,867
% on
rev.
100%
542,228
102,719
644,947 59%
3,048
107,340
151,627
178,860
45
437,872 40%
0%
9M 2021
UNAUDITED
883,328
467,446
90,789
558,235
HANNELemegildo ZErmenegildo Zegna Group
2,283
% on
rev.
100%
63%
97,913
104,707
119,756
434
322,810 37%
0%
4% vs 9M
2021
+22.9%
+16.0%
+13.1%
+15.5%
+9.6%
+44.8%
+49.4%
(89.6%)
+35.6%
+33.5%
1H 2022
1H 2021
UNAUDITED UNAUDITED
728,993
361,850
66,174
428,024
63,402
118,992
116,309
35
298,738
2,231
603,340
317,814
60,734
378,548
58,368
81,485
77,379
323
217,555
7,237
NOTE: Revenues are after eliminations
Zegna branded products include apparel, bags, shoes and small and large leather goods, as well as licensed goods and royalties.
A% vs 1H 2021
+20.8%
+13.9%
+9.0%
+13.1%
+8.6%
+46.0%
+50.3%
(89.2%)
+37.3%
n.m.
3Q 2022
3Q 2021
UNAUDITED UNAUDITED
356,874
180,378
36,545
216,923
43,938
32,635
62,551
10
139,134
817
279,988
149,632
30,055
179,687
39,545
23,222
42,377
111
105,255
(4,954)
4% vs 3Q
2021
+27.5%
+20.5%
+21.6%
+20.7%
+11.1%
+40.5%
+47.6%
(91.0%)
+32.2%
n.m.
19View entire presentation