Investor Presentation
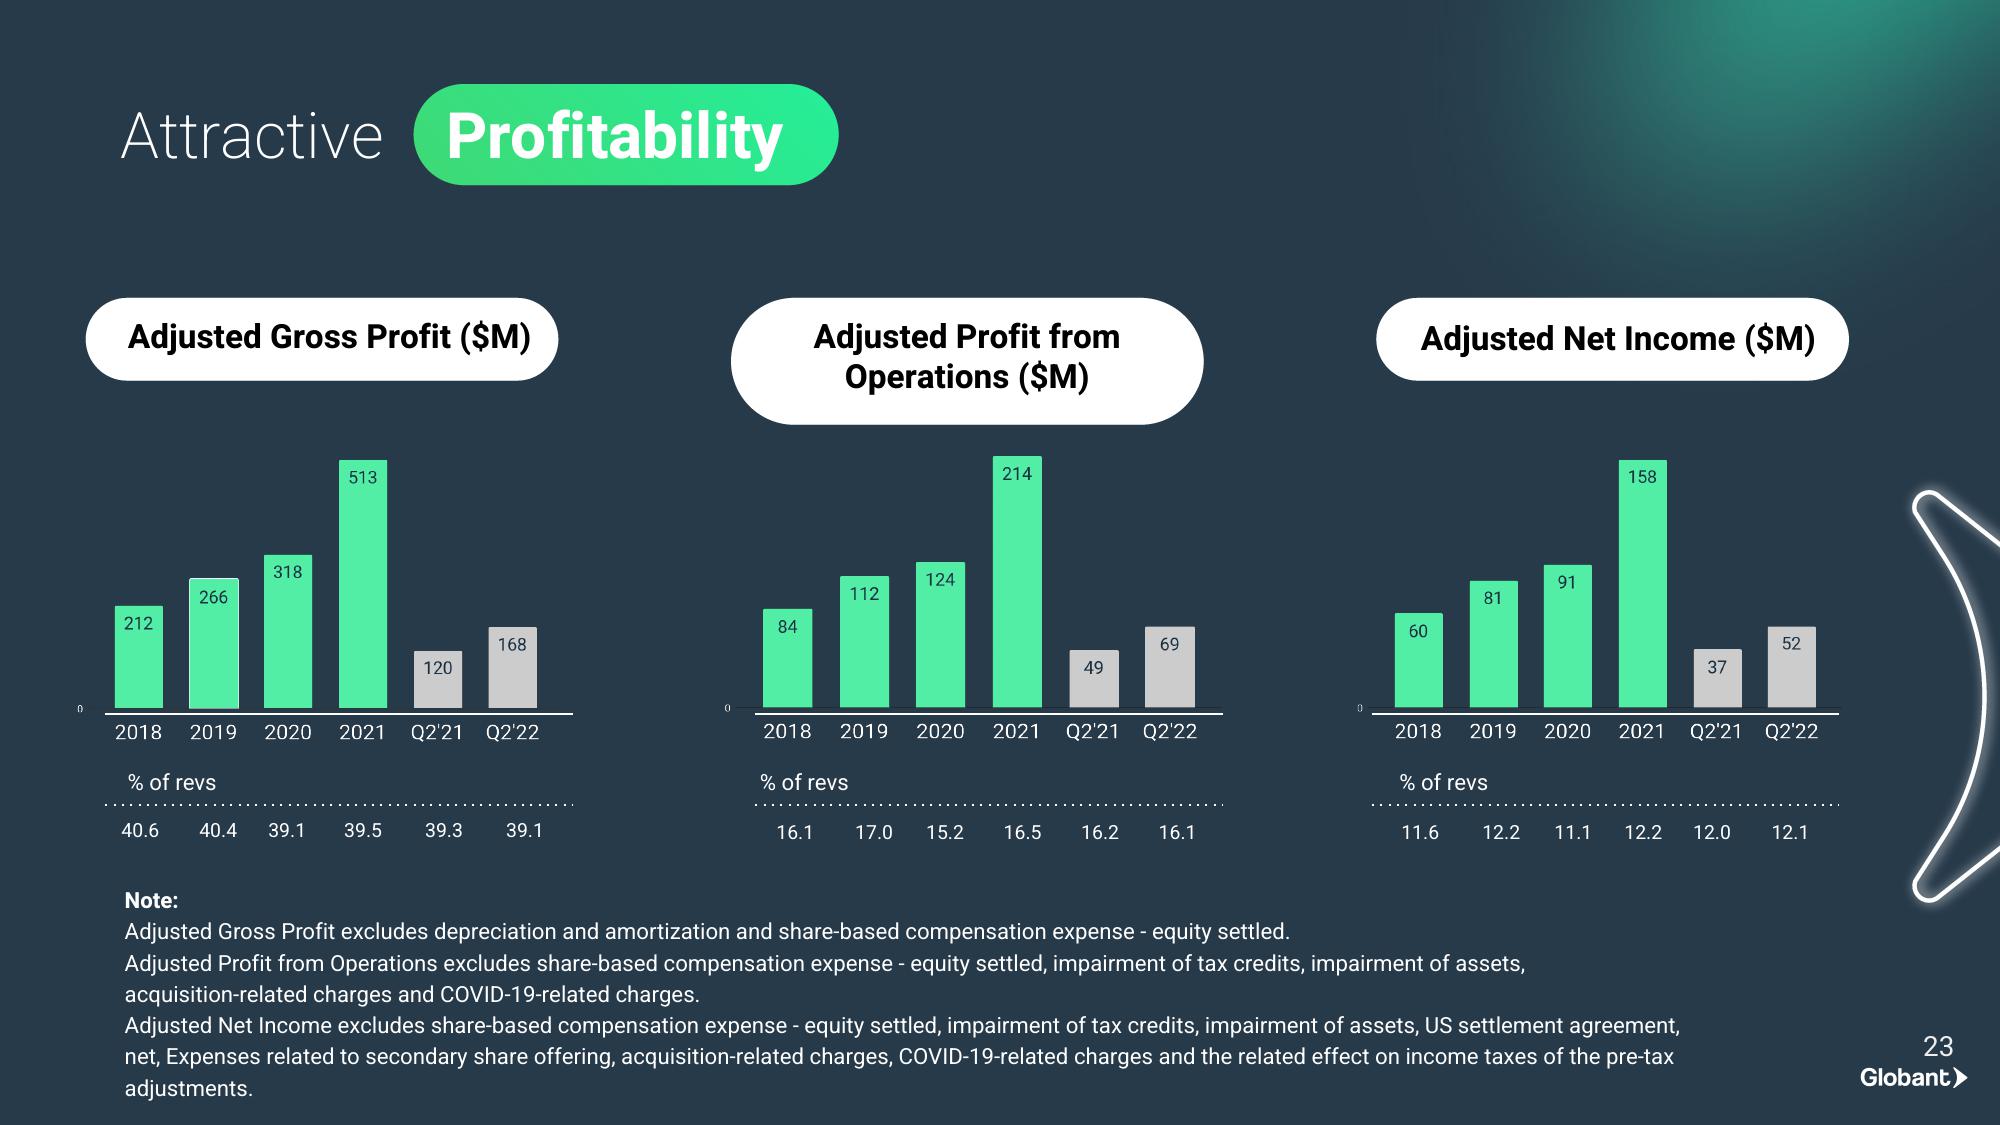
Attractive Profitability
Adjusted Gross Profit ($M)
266
212
318
513
Adjusted Profit from
Operations ($M)
124
112
84
168
120
214
69
49
Adjusted Net Income ($M)
60
ul..
2020 2021 Q2'21 Q2'22
2018
2019 2020 2021
Q2'21 Q2'22
2018 2019 2020 2021 Q2'21 Q2'22
2018
2019
% of revs
% of revs
% of revs
40.6
40.4 39.1
39.5
39.3
39.1
16.1
17.0 15.2 16.5 16.2
16.1
11.6
Note:
12.2 11.1 12.2 12.0 12.1
Adjusted Gross Profit excludes depreciation and amortization and share-based compensation expense - equity settled.
Adjusted Profit from Operations excludes share-based compensation expense - equity settled, impairment of tax credits, impairment of assets,
acquisition-related charges and COVID-19-related charges.
Adjusted Net Income excludes share-based compensation expense - equity settled, impairment of tax credits, impairment of assets, US settlement agreement,
net, Expenses related to secondary share offering, acquisition-related charges, COVID-19-related charges and the related effect on income taxes of the pre-tax
adjustments.
23
Globant➤View entire presentation