Goldman Sachs Investment Banking Pitch Book
Goldman
Sachs
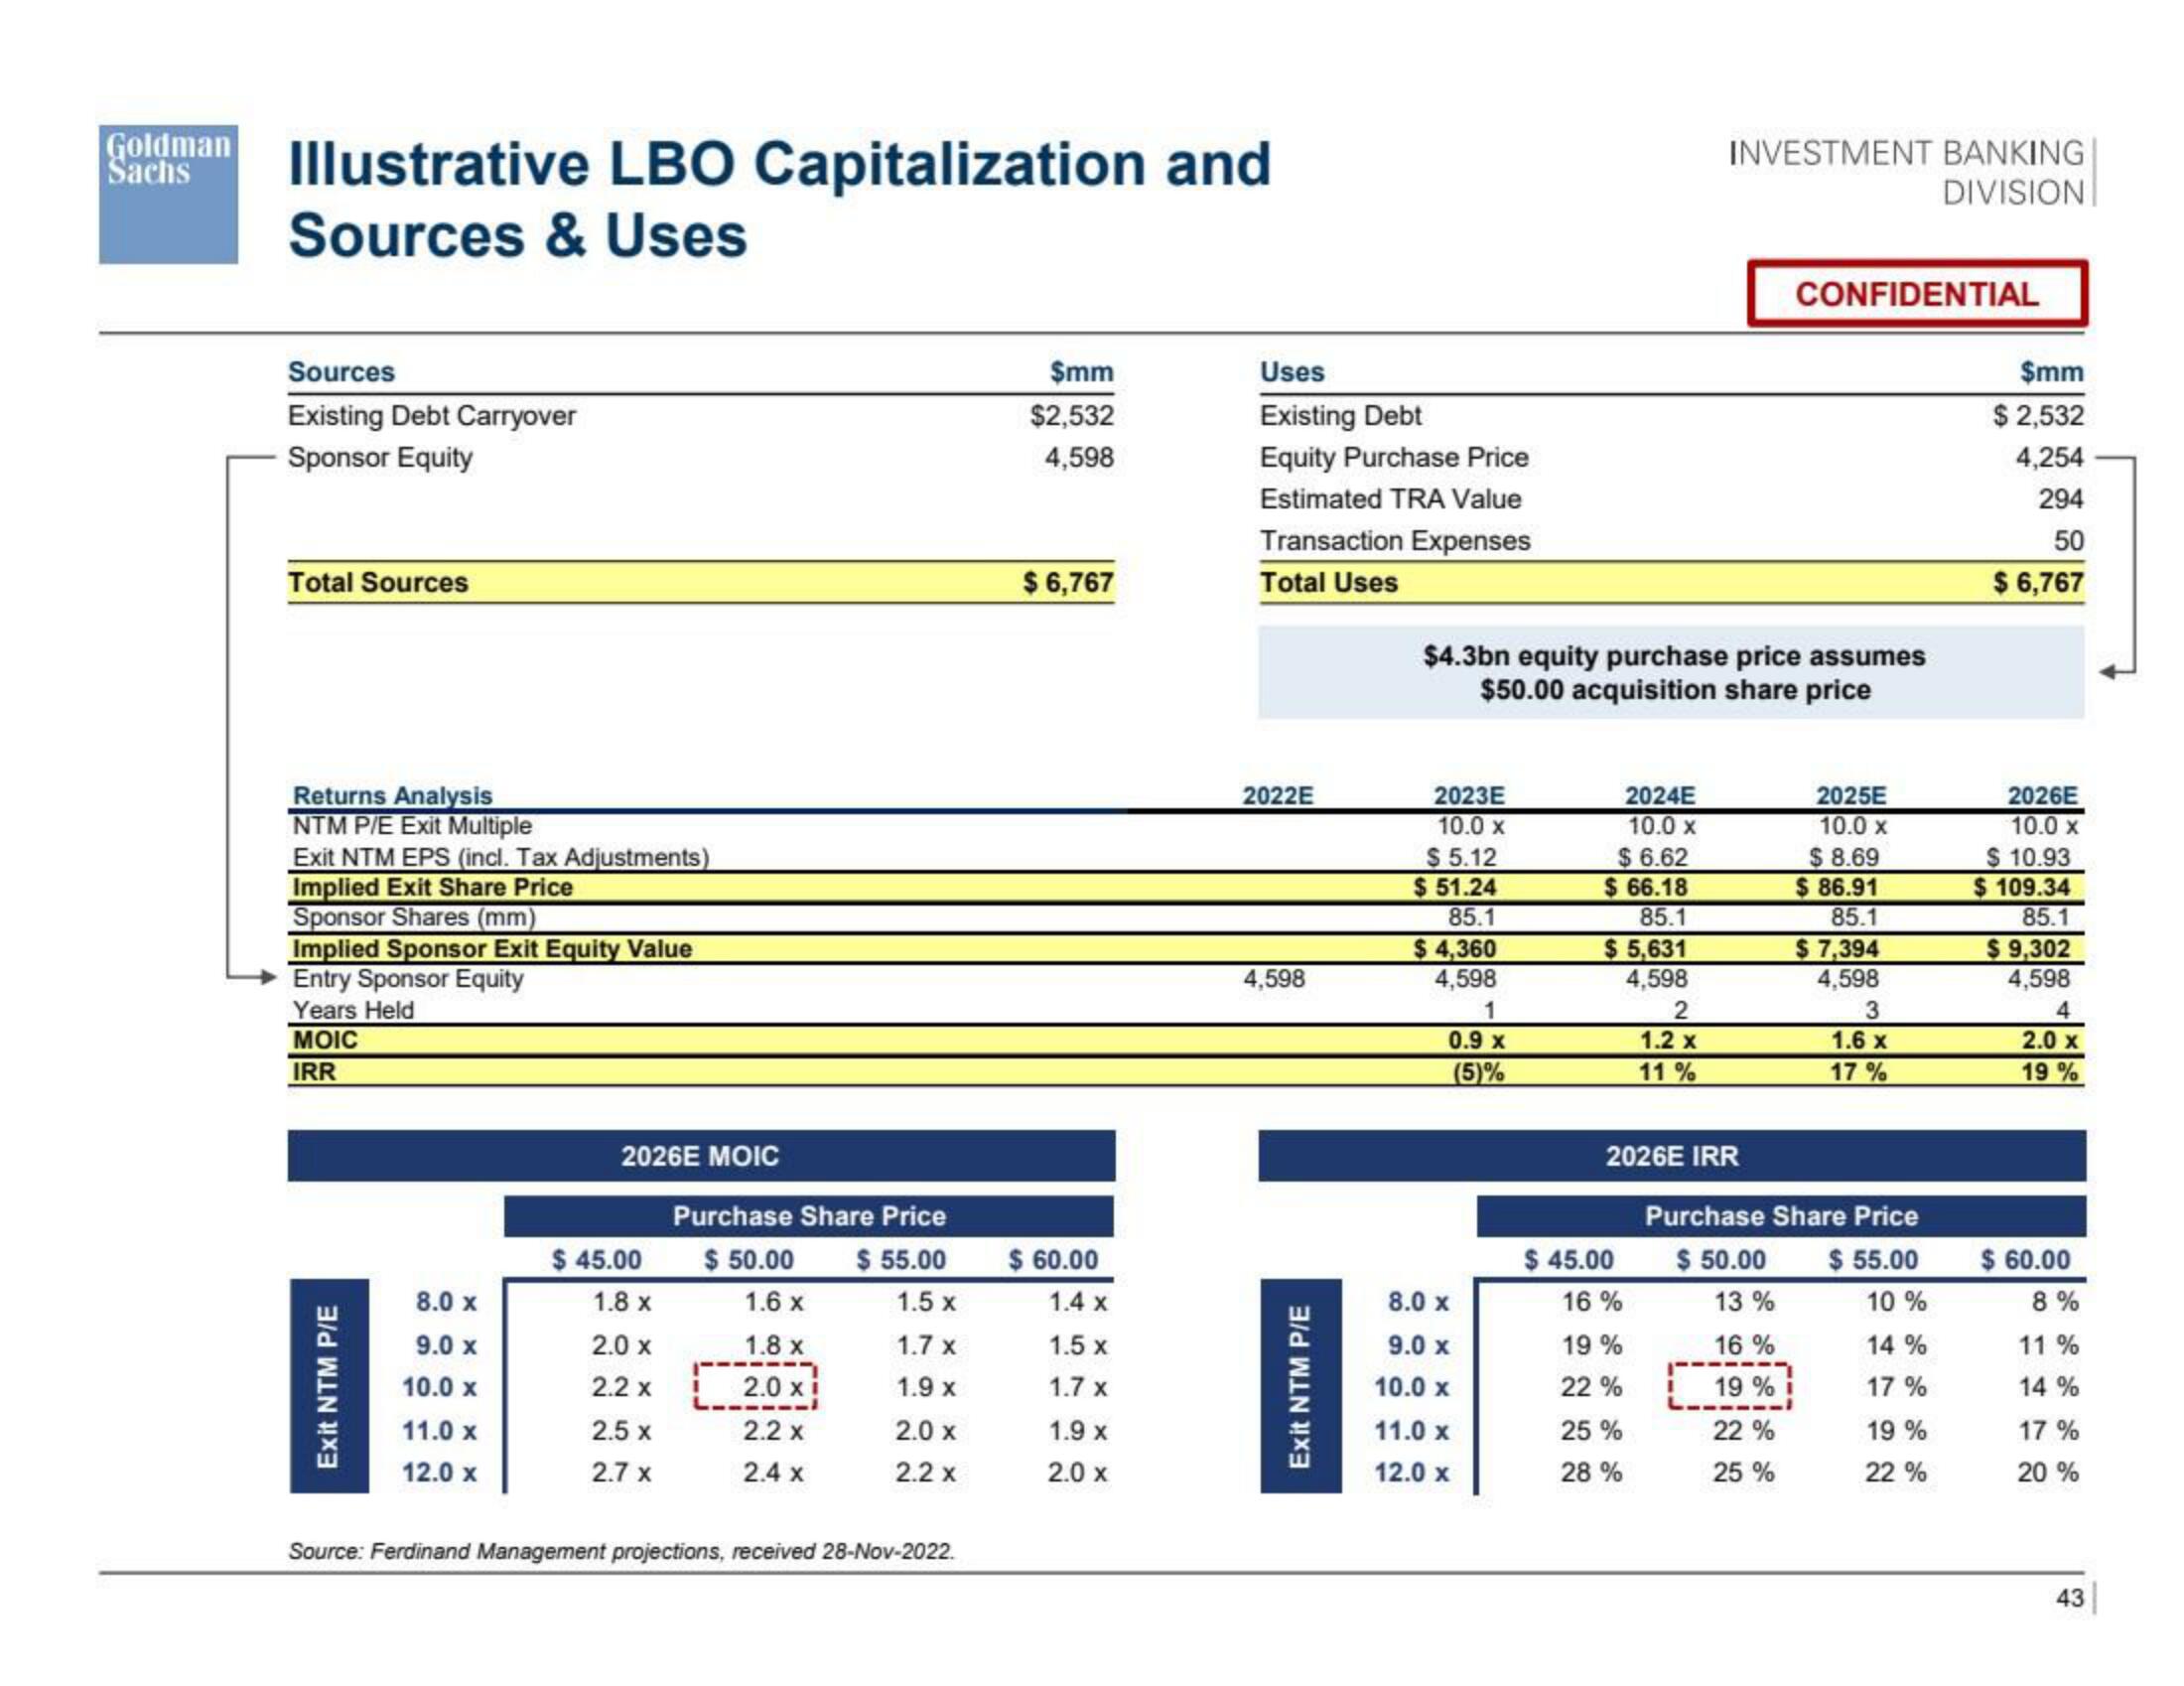
Illustrative LBO Capitalization and
Sources & Uses
Sources
Existing Debt Carryover
Sponsor Equity
Total Sources
Returns Analysis
NTM P/E Exit Multiple
Exit NTM EPS (incl. Tax Adjustments)
Implied Exit Share Price
Sponsor Shares (mm)
Implied Sponsor Exit Equity Value
Entry Sponsor Equity
Years Held
MOIC
IRR
Exit NTM P/E
8.0 x
9.0 x
10.0 x
11.0 x
12.0 x
2026E MOIC
$ 45.00
1.8 x
2.0 x
2.2 x
2.5 x
2.7 x
Purchase Share Price
$ 55.00
I
$ 50.00
1.6 x
1.8 x
2.0 xi
2.2 x
2.4 x
1.5 X
1.7 x
1.9 x
2.0 x
2.2 x
Source:Ferdinand Management projections, received 28-Nov-2022.
$mm
$2,532
4,598
$ 6,767
$ 60.00
1.4 x
1.5 x
1.7 x
1.9
x
2.0 x
Uses
Existing Debt
Equity Purchase Price
Estimated TRA Value
Transaction Expenses
Total Uses
2022E
4,598
Exit NTM P/E
2023E
10.0 X
$ 5.12
$51.24
85.1
$4,360
4,598
1
0.9 x
(5)%
$4.3bn equity purchase price assumes
$50.00 acquisition share price
8.0 x
9.0 x
10.0 X
11.0 x
12.0 x
2024E
10.0 x
$6.62
$66.18
85.1
$5,631
4,598
$ 45.00
16%
19%
22%
INVESTMENT BANKING
DIVISION
2
1.2 x
11%
2026E IRR
25 %
28%
CONFIDENTIAL
$ 50.00
13 %
16 %
19%
22%
25 %
2025E
10.0 x
$8.69
$ 86.91
85.1
$7,394
4,598
3
1.6 x
17%
Purchase Share Price
$ 55.00
10%
14 %
17%
19 %
22%
$mm
$ 2,532
4,254
294
50
$6,767
2026E
10.0 X
$10.93
$ 109.34
85.1
$ 9,302
4,598
4
2.0 x
19%
$ 60.00
8%
11 %
14%
17%
20%
43View entire presentation